Lab 15: Investigating Outdoor Air Pollution
Introduction
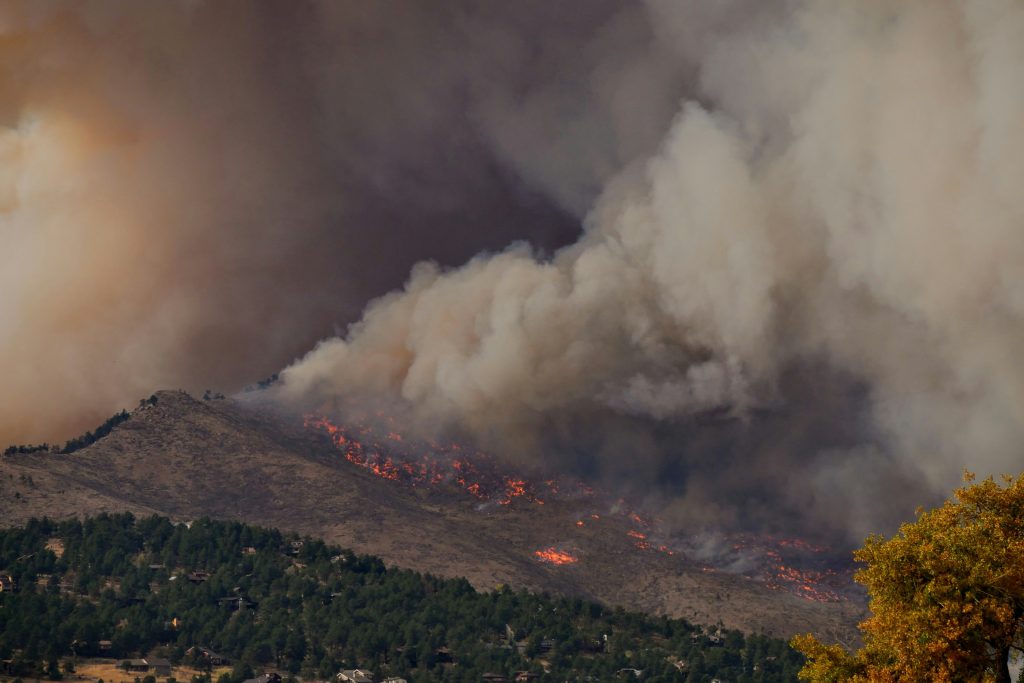
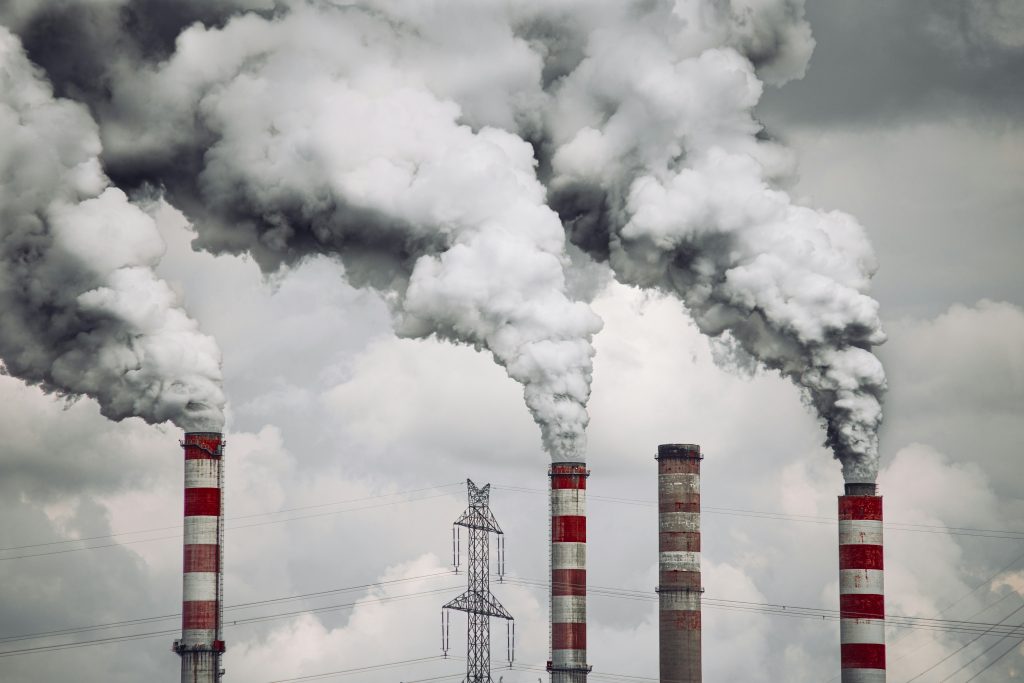
Outdoor air pollution is a significant environmental issue that impacts both human health and ecosystems worldwide. Wildfires (Figure 15.1), dust storms, and volcanic eruptions can release considerable amounts of particulate matter (PM) into the atmosphere. This particulate matter can spread far from the source. Anthropogenic sources of pollutants such as sulfur dioxide (SO2), nitrogen oxides (NOx), carbon monoxide (CO), and particulates are emitted into our air primarily through industrial activities (Figure 15.2), transportation, and agriculture. These, too, can significantly alter air quality well beyond their points of origin. In this lab, you will model the dispersion of these pollutants under different conditions and study their effects on air quality.
Lab Objectives
In this lab, you will:
- Understand the sources and impacts of key air pollutants.
- Analyze how weather conditions, topography, and human activities influence air quality.
- Explore strategies to reduce outdoor air pollution in urban and industrial settings.
Part 1: Movement of Pollutants
Chemical and particulate pollutants pose serious risks to air-breathing animals (including humans!) and other organisms. In this part of the lab, you will model and evaluate conditions that influence the spread of pollution from a point source, then try to mitigate effects for nearby urban areas.
- Go to the Concord Consortium STEM Resource Finder. If you are a first-time user, select Register and register as a student to create a free account. You will need the unique class word for your class from your instructor. Once registered, you will be able to access the material assigned by your instructor.
- Select the assignment Will the air be clean enough to breathe?
- Review the material in Activity 2: Measuring air quality. If told by your instructor, record your responses in the spaces provided on each page of this activity.
- Go to Activity 3: Movement of Pollutants and page 2, How do pollutants move? Explore the features of the model. Recording your results for this page is optional. You should now be ready to experiment with the next model.
- Go to page 3, Weather and Geography. Read the text at the top of the page. Manipulate one variable at a time: either wind, sunlight, or rain. Run the model by hitting the play button. Pay attention to the graph while the model is running. Select the reset arrow at the top left of the model screen between each trial. Answer question 1 on Part 1 of the Lab Response Form.
- Next, manipulate two variables of your choosing at once. Run your model and answer questions 2-3 on Part 1 of the Lab Response Form.
- Go to page 5, Regional Pollution. Watch the demonstration to see the direction of the wind and pollution and the resulting air quality for each city.
- Add 3 power plants with the goal of fair to good air quality for each city.
- Run your model during the summer and winter, resetting between seasons and trials. Answer question 4 on Part 1 of the Lab Response Form.
- Study the graph in question 12 on the screen. Provide a scenario that would explain the changes in air quality over time as shown by the graph. Consider the occurrence and location of pollution sources. Seasonal wind directions are consistent with what you previously observed. Answer question 5 on Part 1 of the Lab Response Form.
- Bonus: Go to page 7, Adirondack Lakes. Answer question 5 on Part 1 of the Lab Response Form.
Part 2: Pollutants and their Effects
Gain a deeper understanding of different types of pollutants in this part of the lab, then use your knowledge of pollution movement and graphs to interpret a potential scenario related to a forest fire. Finally, analyze the occurrence and spread of real-world pollution events in North America using data garnered through the partnerships of U.S. federal agencies and departments, along with tribal, state, and local governments.
- Go to Activity 4: Visible and Invisible Pollutants. Read over the various kinds of pollutants on pages 2-8. Answer question 1 on Part 2 of the Lab Response Form.
- Next, go to page 9, Pollutants and their effects. Read the brief explanation at the top of the page, then study the graph. Answer questions 2-3 on Part 2 of the Lab Response Form.
- Go to the Air Now site. Enter your location or a location of your choosing. Note the Air Quality Index Scale on the left side of the screen. Answer question 4 on Part 2 of the Lab Response Form.
- Next, go to the Maps & Data menu at the top of the page. Explore the Interactive Map of Air Quality for the United States. Answer question 5 on Part 2 of the Lab Response Form.
- Optional: Go to the U.S. Environmental Protection Agency’s Air Quality Data page. Using the Daily Air Quality Tracker, choose a pollutant, year, and geographic area to investigate. Select Plot the Data. Answer question 6 on Part 2 of the Lab Response Form.
References
AirNow. 2025. AirNow.gov – Home of the U.S. Air Quality Index. https://www.airnow.gov/
Concord Consortium. 2025. High Adventure Science: Will the air be clean enough to breathe? Version: v2.22.3 (React 18.3.1) https://learn.concord.org/has-air
United States Environmental Protection Agency. 2025. Air Data: Air Quality Data Collected at Outdoor Monitors Across the US. https://www.epa.gov/outdoor-air-quality-data
Lab 15 Response: Investigating Outdoor Air Pollution
Download this Lab Response Form as a Microsoft Word document.
Part 1: Movement of Pollutants
- Describe the change in the Air Quality Index (AQI) over time for each variable: wind, sunlight, and rain. Indicate different outcomes for the variations in wind direction and speed, amount of sunlight, or frequency of rain. You may create a table to summarize your results, if preferred.
- Include a screenshot of your settings and graph when you manipulated at least 2 variables. Interpret the plots on your graph. Briefly explain the influence of rain, sun, and wind on the AQI. What caused the primary pollutants to regularly increase and decrease?
- How did mountains and flat areas influence the amount of pollution in or near your city?
- Include screenshots showing the appropriate wind direction for each season. Explain how you achieved your goal.
- Insert a screenshot of the graph. Write a scenario below your graph that would explain the changes in air quality over time as shown in the graph.
- What and where is the probable source of pollution that impacted the Adirondack lake shown in the picture? Explain why the acid rain occurred in the Adirondacks instead of somewhere closer to the pollution source.
Part 2: Pollutants and their Effects
- For each pollutant you studied, summarize your findings in a table. Include the name of the pollutant and the following categories: chemical, physical, anthropogenic sources, natural sources, effects on human health. You may add another category of your choosing. Find and cite other reputable sources to help you complete your summary. Compare your summary with those of your classmates, if possible.
- State which line or lines on the graph show the pollution level over the city during and after the forest fire. Explain your rationale for the possible line or lines as well as the one(s) you eliminated as possibilities.
- Of the pollutants you just learned about, which one(s) do you think may be problematic during and after the forest fire? Explain your reasoning.
- Name your location and describe the Air Quality Index for the area. What was the primary pollutant? Describe the AQI forecast and relate it to weather or other events.
- Describe notable events on the map: were there any fires, smoke plumes? In what region did they occur? Broadly, in what kind of landcover (e.g., mountains, forests, plains, urban areas) did they occur? Compare your findings with those of your classmates. What surprised you?
- Provide a screenshot of the graph you obtained from the daily air quality tracker. Describe how that year’s air quality compared to the long-term average. Investigate past weather for that time period. Cite your source(s) and note any potential relationship to that area’s weather patterns.
