Lab 19: Human Population Impacts

Introduction
In July 2024, the Population Division of the Department of Economic and Social Affairs (DESA) at the United Nations released the World Population Prospects 2024 report. Among the key findings documented in that report: women on average have one child fewer than they did in 1990, the global population is expected to peak by the end of the 21st century, and by 2080 persons aged 65 or older are projected to outnumber children under 18. The report further notes that these shifts are following a period of “unprecedented population growth” throughout the world beginning in the middle of the twentieth century. Figure 19.1 depicts a crowd of people in an urban environment (specifically, at a Chicago craft fair). As the global human population is predicted to grow throughout the century, in which countries are populations growing or declining, and what factors cause population growth to stabilize or reverse? How does human population growth or decline impact the environment? What solutions can we offer to mitigate any harmful effects humans create? This lab will ask you to reflect on these questions and more.
In this lab, you will:
- Interpret graphs to determine how populations of different countries have changed over time.
- Investigate how populations of different countries are predicted to change over time and critique the assumptions behind population predictions.
- Explain the impact of human populations on one facet of the environment.
- Summarize at least one solution to issues caused by population growth.
Part 1: Reading Charts for World and Country Demographic Data
The United Nations has tracked changes in human populations across different countries since about 1950 and has released predicted populations through 2100. For the first half of this lab, you’ll be asked to compare both past and future predicted populations of two countries to each other and to the world.
Lab Directions
- Start by accessing the United Nations DESA Population Division’s Graphs and Profiles page.
- Select the location World from the drop-down list on the left, then select a graph type of Demographic Profiles and then Line Charts. (See Figure 19.2 below.)
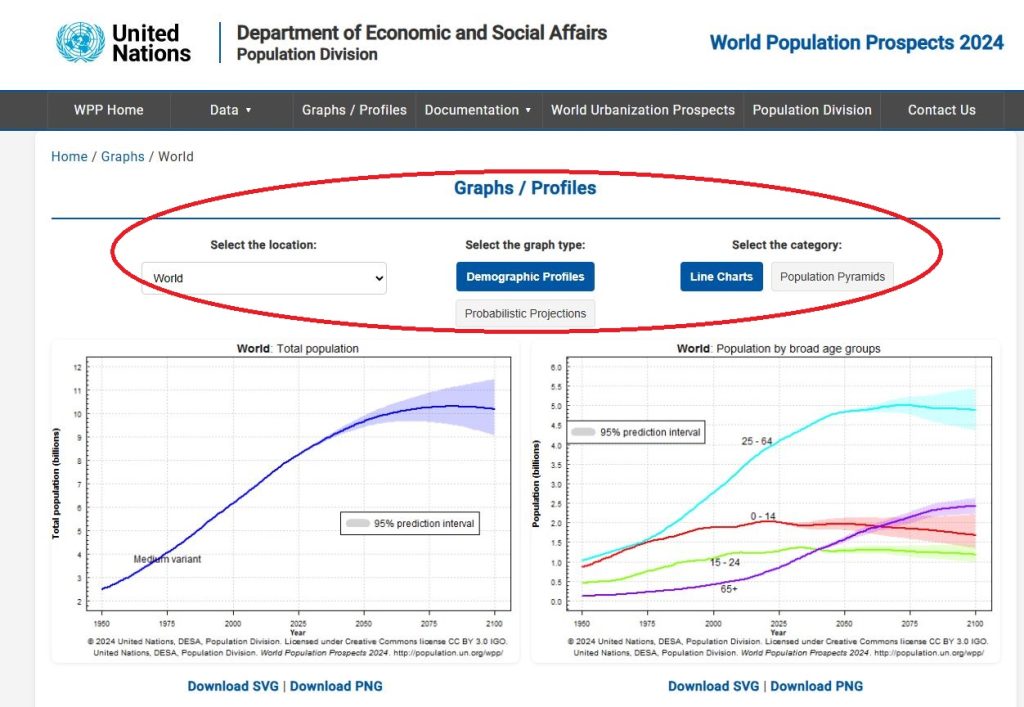
Figure 19.2: This screenshot depicts which options to select in the World Population Prospects database. - Follow the instructions in Part 1 of the Human Population Impacts Lab Response form as you analyze, reflect and respond to questions about the demographic profile line charts for the entire world and two separate countries.
Part 2: Impact of Population Growth on Social Development and on the Environment
Now that you have seen how the human population has changed from 1950 to the present and reviewed different predictions for what might happen to the world’s and two different countries’ populations through 2100, let’s talk about how the human population impacts social development as well as the environment.
Lab Directions
Review the following two sources linked below:
- Understanding Global Change, Population Growth.
- United Nations Department of Economic and Social Affairs, Why population growth matters for sustainable development.
After reading both sources above thoughtfully, complete Part 2 of the Human Population Impacts Lab Response form.
References
Lab inspired by Doser, D. (2017) Comparing Human Population Trends, On the Cutting Edge Exemplary Teaching Collection. Retrieved March 24, 2025, from https://serc.carleton.edu/teachearth/activities/180287.html
United Nations Department of Economic and Social Affairs, Population Division. (n.d.). World Population Prospects: Graphs/Profiles. World Population Prospects, 2024. Retrieved March 24, 2025, from https://population.un.org/wpp/graphs?loc=900&type=Demographic%20Profiles&category=Line%20Charts
University of California Museum of Paleontology. (©2025). Population growth. Understanding Global Change. https://ugc.berkeley.edu/background-content/population-growth/
Wilmoth, J., Menozzi, C., & Bassersky, L. (2022). Why population growth matters for sustainable development (Future of the World: Policy Brief 30). United Nations Department of Economic and Social Affairs. https://www.un.org/development/desa/pd/sites/www.un.org.development.desa.pd/files/undesa_pd_2022_policy_brief_population_growth.pdf
Lab 19 Response: Human Population Impacts
Download this Lab Response Form as a Microsoft Word document.
Part 1: Reading Charts for World and Country Demographic Data
- Start at the World: Total population line chart. What has happened to the total population between 1950 and the predicted population range in 2100? Explain your answer.
- Now, look at the World: Population by broad age groups chart. What trends do you see? Explain how the population of each age group has changed between 1950 and the predicted population in 2100.
- Look at the World: Annual Rate of population change chart. What trend do you see here? Explain your answer, including how the topic of this chart differs from the World: Total population chart.
- Now pick a country from North America or Europe from the Select the location dropdown box. Take a screenshot of the Total Population chart or click the link below the chart to download the chart as a PNG. Paste the chart below.
- Look at the Total population line chart for the country you chose. What has happened to the total population between 1950 and the predicted population range in 2100? Explain your answer.
- Now, look at the Population by broad age groups chart for the country you chose. What trends do you see? Explain how the population of each age group has changed between 1950 and the predicted population in 2100.
- Now look at the Annual rate of population change chart for the country you chose. What trend do you see here? Explain your answer.
- Compare: how do the charts for the country you selected reflect or differ from the trends found in the world population charts? List three concrete similarities and/or differences.
- Now pick a second country from either Asia, Africa, South America, or the Caribbean from the Select the location dropdown box. Take a screenshot of the Total Population chart for your new country or download the chart as a PNG. Paste the chart below.
- Look at the Total population line chart for the second country you chose. What has happened to the total population between 1950 and the predicted population range in 2100? Explain your answer.
- Now, look at the Population by broad age groups chart for the second country you chose. What trends do you see? Explain how the population of each age group has changed between 1950 and the predicted population in 2100.
- Now look at the Annual rate of population change chart for the second country you chose. What trend do you see here? Explain your answer.
- Compare: how do the charts for the second country you selected reflect or differ from the trends found in the world population charts? List three concrete similarities and/or differences.
- Computer models for population growth are built based upon current circumstances. List two unforeseen circumstances that might occur to cause these models to be wrong. (Hint: if you look at the chart for the Annual rate of population change for Northern America, what happened to the population in 2020 and why?)
Part 2: Impact of Population Growth on Social Development and on the Environment
- Who created the Understanding Global Change website? Are they an expert source? To answer this question, look at both the organization that created the website as well as its advisors and authors.
- List at least three ways that human population growth impacts the environment, providing detail. Follow the links on the population growth page in order to get more information on each topic. You can also summarize pertinent passages from your textbook. Be sure to cite your sources, either with a page name and link from the Global Change website or with your textbook’s module information.
- Try this in practice: Look for one additional expert popular article or website that documents a connection between human population growth and one of the topics you listed in the question above in more detail. Cite the website in APA or CSE format. (Find examples on an APA citation guide or CSE citation guide.) Below the citation, explain why the source is credible using SIFT (see Lab Activity 1).
- Summarize your source: What new information did you learn from your source?
- The report “Why population growth matters for sustainable development” states that changes in population trends alone will not fix issues with unsustainable resource use. Summarize at least two arguments the authors make for why this is the case.
- Wilmoth and his co-authors offer solutions beyond solely reducing the global population. What are they? Summarize and explain.
