Lab 1: Introduction to the Scientific Method, Information Literacy, and Data Literacy
Introduction
Science is characterized by its underlying interest in making sense of things. It does so first by proposing explanations for natural phenomena, and then by devising experiments to test these explanations. The adherence to a rigorous process in testing ideas about how some part of the natural world works is called the scientific method.
The process of scientific inquiry begins with observations that may lead to general questions about a phenomenon. Based on previous knowledge and research, one can develop potential explanations for these observations. The next step involves formulating a hypothesis, a specific and testable statement that examines only one changeable factor (or variable). To support or disprove the hypothesis, one can design an investigation or experiment that yields information (or data).
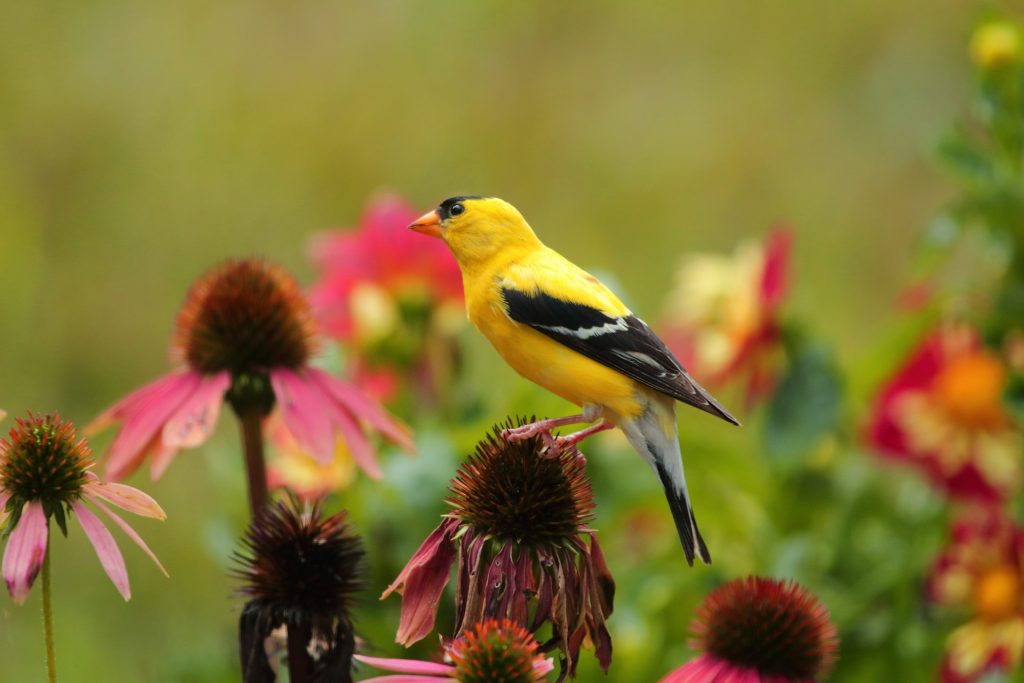
For the instructions for this lab, we will focus on researching, designing experiments, and processing data related to bird–window collisions such as those experienced by the goldfinch population pictured in Figure 1.1. The focus of this lab is to engage you with the key ideas involved in conducting scientific inquiry. You will become familiar with asking questions about observed phenomenon, using research to create scientific questions, developing testable hypotheses, designing experiments, interpreting data, and evaluating the scientific rigor of particular claims. Once you have seen these skills demonstrated in the Lab Instructions, you will be asked to replicate them using a different topic in your Lab Response form.
Lab Objectives
In this lab, you will:
- Explain the process of scientific inquiry.
- Develop a set of research keywords and evaluate search results.
- Define the following terms: hypothesis, variable, experimental control, treatment, sample size, and data.
- Design a scientific experiment with a testable hypothesis.
- Evaluate and build a graph to portray research results.
Part 1: Asking Scientific Questions and Finding and Evaluating Information (Information Literacy)
Scientists often observe phenomena and are curious about them. They then ask questions about what they have observed. Scientific questions that lead to explanations founded on evidence from the natural world are focused, measurable, and can be compared or controlled. Such questions go beyond simple factual queries and allow for conclusions based on measurable, observable phenomena.
For example, one morning you hear a loud knock as something hits one of the windows of your home. You head to the window and look down to see a small bird lying stunned on the ground. After a few minutes, it stands and flies off. As you think about the bird, you may begin to wonder why this happened and how often it occurs. You remember that a friend has told you about stickers they recently put on their windows to protect birds, but you are not sure if they really work.
In order to investigate this question, it’s important to narrow your focus and frame the question in a measurable way. If you begin with the question “Do window stickers reduce harm to bird populations?” there are too many variables to answer that question thoughtfully.
One way to narrow your original research question is to list other questions you might need to answer in order to better understand your topic. Your list of questions about bird collisions might begin with some of the following:
- How many birds are impacted by window collisions?
- Are certain types of birds more likely to accidentally strike windows?
- Are stickers an effective way to stop bird–window collisions?
- Should the stickers be placed on specific locations on the windows?
Research will help you to answer some of the questions above and create the focused, measurable question that will lead to a strong hypothesis (explanation or theory) about how window stickers impact your local bird population.
Doing good scientific research involves gathering background information on your topic; deciding what keywords from your research question you will use to search; carefully choosing where to search; evaluating the information you find to see if it appears to be credible (believable), authoritative (written by experts), and up-to-date (as scientific knowledge is continuously evolving, using out of date information can lead you astray); and finally, using that information in an ethical way.
This series of steps is known as Information Literacy. Students who have mastered these skills can feel confident that they are asking good scientific questions and answering those questions with the best information available. Future labs will help you to learn how to distinguish between different types of scientific information and how to evaluate the results you get. This lab will focus on developing and revising keywords in order to gather information.
Gathering Background Information and Developing Keywords
Dictionaries and encyclopedias provide background information that will help you determine which of your questions are most important. Your campus library might have a subscription to a reference database like Gale eBooks, or you might use Wikipedia as a place to begin learning about your topic.
Do not start your research by typing your question into the search box. Instead, break your research question into keywords. This will allow you to get the largest set of focused results for your search. For example, the Google search birds and window collisions and Wikipedia leads to the Bird–window collisions Wikipedia article. In the article, you will learn that:
- This is a significant problem that impacts hundreds of millions of birds in the United States and Canada.
- Transparent glass poses a special challenge to birds.
- There are several possible ways to alleviate this problem. Stickers that are placed on the outside of windows are thought to help.
- Different bird species are more likely to strike suburban homes (wood thrushes) or high-rise condos in a city (warblers).
From the Wikipedia article, you can discover additional keywords you can use in your search, such as bird strike, decal, and thrush (or another species of bird). What other keywords might you be able to use?
Modifying Your Search Results
Once you have a draft list of keywords, it’s time to start searching. While there are many possible search engines and future labs will suggest specific databases to search for information, we’ll use Google and Google Scholar for this lab.
As you read through your search results, you may notice that they don’t really focus on the topic you are interested in. Changing your search words can radically change the results. For example, see Figure 1.2 below, which compares the first four results from two Google Scholar searches: bird window collision and mitigation versus bird window collision and mitigation and decals.
The articles from the first search talk about various factors causing and mitigating bird–window collisions. Adding the word decals to the search leads to articles that discuss the relationship between bird–window collisions and stickers.
Depending on how you choose to focus your research, you might want articles from only one of the searches or from both. As you look through your results, develop a habit of writing down words, phrases, and other ideas that catch your attention, as you may need to use them to address unanswered questions from your other sources.
Interpreting and Evaluating Your Search Results
Once you have used keywords to produce an initial list of search results, you’ll need to evaluate those results to see which ones come from expert sources and which ones might be less authoritative. We’ll begin by evaluating general websites and then we will focus on two common sources of scientific information: popular news articles and scholarly articles.
Interpreting Your Research Results: Evaluating general websites
The SIFT strategy, designed by Mike Caulfield, is a good way to test the information you find to make sure it is accurate and authoritative. What follows is a short explanation of SIFT. You can find more about SIFT as a technique for evaluating information on the author’s website.
- Stop!
- Investigate the source
- Find better coverage
- Trace claims, quotes, and media to the original context
Stop
Before you read the information, ask yourself what you already know about the topic (what information would you expect to see?) and the website that published it. What is the website’s mission? What type of information would you expect to see covered? This step is especially important when the headline, image, or lead sentences of an article provoke a strong emotional reaction.
Investigate the source
Begin by asking if the individual author of your work is an expert in some way. This might include their education or life experience. If the information you find does not have an individual author, look at the group that takes responsibility for the website. (For example, the Environmental Protection Agency does not generally list individual authors of content on its pages, but given that experts in environmental sciences work there, the information found on its pages can be assumed to be reliable. See their page on energy and the environment as an example.)
If you cannot easily find information about your author on the source you’re using, search for more information using Google or another search engine. Most professional authors will have a website where they list their education, experience, and the focus of their work.
Find better coverage
If you are quoting something that might be questionable, such as a website that might be biased, doesn’t have a clearly labeled author or corporate author, or has information that might be out of date, look for the information you need in a trusted source such as a newspaper, scholarly article, government website, or other place where information is put together by trusted professionals. If you can find information in a trusted source, use that source instead. (If you’re ever hesitant about whether your information is too old, speak with your professor about the right date range for your topic.)
Trace claims, quotes, and media to the original context
If the source you are evaluating has images, quotations, or claims from other sources, try to find them in their original context. You can follow a citation, search Google for recognizable text, or even right-click on an image to search Google for other places the image might be published. This will help you determine if your original source is accurately representing the image, claim, or quotation.
By following SIFT as you encounter information online, you should be able to determine if your source is trustworthy and relevant to your research and either use the source confidently or keep looking. The best way to evaluate information is to use multiple sources and test the claims each makes against the information found in the others.
For example, when might it be appropriate to use the corporate website of a decal manufacturer to gather data about how well the decals work to stop bird–window collisions? When might it not be? What other sources might you look for to ensure that the information is accurate?
Interpreting Your Research Results: News articles
Some of the results that you found in your initial Google search might be newspaper or magazine articles. Newspaper and magazine articles tend to be written for the general public. They are written by journalists who may have expertise in the topic and are edited by professional editors. They often use catchy titles and images to catch the reader’s attention. Popular articles on scientific topics can summarize the results of one or several experiments. See the example below to see characteristics of a popular source:
Notice the image, the author information, and the tagline of the article right underneath the title, which explains the results of a new scientific study. If you’d prefer, you can read the whole article online.
Interpreting Your Research Results: Scholarly sources
Scientific scholarly articles tend to be written by scientists, including college professors, people who work in research labs, and other scientific professionals. They will either summarize the results of a single experiment (a research article) or the results of several (a review article).
Peer-reviewed articles are published in scholarly journals. The phrase peer-reviewed means that the articles in the journal have been reviewed by other scientific experts on the topic of the article before being published. They are written for people who are or want to be experts on an academic subject (as a college student, that includes you) and have characteristics that make them easily identifiable. See the image of a scholarly article below:
In addition to the traits listed above, scholarly articles will include citations.
You can learn more about popular and scholarly articles on the library guide Scientific Articles: Popular or Scholarly? You can find scholarly articles through general web searches, or from specialized databases such as Google Scholar, Academic Search Ultimate, or Science Direct.
Pausing Your Research: Gathering and summarizing information
Once you have answered enough of your preliminary questions about the topic, you can create the focused, measurable scientific research question that will guide your experiment.
In this case, the research question has moved from
Do windows stickers reduce harm to bird populations?
to
Does the application of decals arranged in a diagonal pattern on a window prevent more bird strikes than decals applied randomly to a window?
From your research, you’ve also learned that bird–window collisions occur more frequently during the birds’ annual migration north or south, so you know what dates to conduct your experiment.
Part 2: The Scientific Method (Building Scientific Experiments)
Once you have formed your measurable, focused question, you can design an experiment to produce data that will help you accept or reject your theory.
Scientific inquiry employs both inductive and deductive reasoning. Inductive reasoning uses specific observations to draw general conclusions or principles; it is the basis of descriptive science. For example, repeated observations indicate that all independent life forms consist of one or more structures called cells. Therefore, a general principle in biology is that cells are the basic units of life. This type of reasoning is probable and falsifiable—sufficient evidence may make an idea highly likely, but that idea can be modified based on new, applicable observations. Deductive reasoning, on the other hand, uses generally accepted ideas to evaluate specific observations. Deduction is heavily employed in hypothesis-based science.
Forming a Hypotheses
When scientists try to answer their questions, they propose tentative explanations called hypotheses. A hypothesis uses a general premise to predict specific results of an observed difference. Hypotheses showing cause and effect can take the form of “If ___________, then _______________” statements with an explanation. Generally the first blank contains a condition that you apply (the independent variable) and is concerned with your experimental variable (the treatment). The second blank is a prediction about the outcome and is concerned with the data to be collected (the dependent variable). Hence, hypotheses are generated, then tested through the careful collection and analysis of data. If the results do not match the prediction, then the hypothesis is rejected. If the results match the prediction, then the hypothesis is accepted or not rejected.
Designing an Investigation
Investigation of the Effect of Window Decals on Bird Window Strikes
In order to test your hypothesis that window decals arranged in diagonal patterns are more effective at preventing bird strikes in suburban areas than windows that have randomly applied decals, you decide to ask neighbors to participate in your experiment. Because the window the original bird struck was on the first floor and faced north, you ask your neighbors to monitor bird strikes on north-facing windows only. You then divide your neighbors into three groups. One group will apply at least 10 decals randomly to their north-facing windows, one group will apply at least 10 decals in a diagonal pattern across their north-facing windows, and the final group will not apply any decals. You ask them to collect data on the number of bird-window collisions for one month.
Identifying Variables
The variables should be clearly defined and measurable. The dependent variable is measured as data (usually quantitative—use numbers). In the experiment above, the number of bird strikes would be the dependent variable. The independent variable is the factor that you change or manipulate in the experiment (i.e., the presence and arrangement of decals on the windows). Because generally only one factor is manipulated, all other factors must be controlled. Controls are used as the baseline for comparison. Experiments include a control group and treatment (or experimental) groups. Only individuals in a treatment group receive the manipulation.
Designing the Procedure
The procedure is the series of steps to be performed in the experiment. So, you might list measurements for how many and where decals might be applied to the windows using a diagonal pattern. You might also list when you’d like neighbors to check for evidence of birds, (daily? each morning?) and for how many weeks. You should also specify where and how the data gathered during the experiment will be recorded. There is a difference between controlled variables (independent variables that can adversely affect experimental results unless they are constant) and the control (which sets a standard or zero level for the independent variable). The validity of an experiment is improved when treatments are repeated (replicated) and multiple individuals are tested (errors are averaged out or minimized). Sample size refers to the number of organisms in a group of study. In general, the larger the sample size, the more accurate the results.
Part 3: Collecting, Reporting, and Analyzing Experimental Data
Once you have designed the experiment, you will need to collect data. Data can be qualitative (descriptive) or quantitative (numerical). The preferred form of scientific data is quantitative, because numbers are more easily organized in tables and graphs and statistical/computer analysis can be applied. For example, quantitative data can be simplified by finding the average. Average values should be shown with a measure of how much the data varied around the average. The standard deviation is one such measure of variability.
Quantitative data can also be organized in tables. Use the following guidelines: tables are titled and numbered, there should be column headings that include units of measurement if relevant, and each table should be referred to and summarized in the text.
While we do not have data from the hypothetical experiment described above, here is a sample of real bird strike data that was gathered on the College of DuPage campus during fall 2023, organized into a table:
| Date of Bird Discovery | Location of Bird Strike | Side of Building? | Additional information about location (i.e., near stairwell) |
Bird species (if known) |
| 8/29/2023 | MAC | East | Glass on back side of building by the pond. | Pine warbler |
| 9/1/2023 | CHC | West | ||
| 9/1/2023 | MAC | North | Near entrance, in one of the shaded areas | Not sure |
| 9/2/2023 | SRC | North | Far left of big front window (near main entrance) | Robin |
| 9/3/2023 | SRC | North | Between bushes and window. 4’ from window. | American robin |
| 9/4/2023 | BIC | North | Courtyard | House sparrow |
| 9/4/2023 | BIC | West | East courtyard | Unknown |
In order to analyze this data, you could summarize categories of data gathered from this experiment into a table. A table that summarizes bird strikes by campus building would look like the example below:
| Campus Building |
Number of Bird Strikes |
Percentage of Total |
| GH (Greenhouse) | 0 | 0% |
| HTC (Homeland Security Training) | 1 | 1% |
| SCC (Seaton Computing Center) | 1 | 1% |
| SSC (Student Services Center) | 1 | 1% |
| CHC (Culinary and Hospitality) | 6 | 5% |
| HSC (Health Science Center) | 10 | 8% |
| HEC (Homeland Security Center) | 14 | 11% |
| PEC (Physical Education Center) | 15 | 12% |
| TEC (Technical Education Center) | 15 | 12% |
| BIC (Berg Instruction Center) | 17 | 14% |
| MAC (McAninch Arts Center) | 20 | 16% |
| SRC (Student Resource Center) | 22 | 18% |
| Total | 122 |
Notice from the sample data in Table 1.1 that you could construct other tables to represent your findings: for example, Table 1.2 does not include data on the type of bird or the direction the window faced. To decide how to construct your table, you’ll want to return to your hypothesis: what data is most important in deciding if there is evidence to support or reject your original hypothesis?
Scientific data is also often presented in graphs, which provide a visual summary of the results. Data trends often become more obvious when graphed. Be sure that the graphs are labeled, measured evenly along the Y axis, and numbered, and include a caption (legend).
Graphs can contain data points and a line(s) (continuous data) or data bars (discrete groups of data). Error bars ┬ may be displayed above and below points or at the top of data bars. The error bars depict the measure of variation of an average, like the standard deviation. When converting your data to graphs you will want to put the independent variable on the x-axis (horizontal line) of the graph and the dependent variable on the y-axis (vertical line).
Notice that the type of graph you choose to display your data will change the way that your audience understands it. Bar graphs will help you to compare categories of objects, whereas line graphs often track objects over time. Compare the bar graph to the pie chart below. Both are built using the data represented in Table 1.2:
The pie chart makes it easy to estimate which buildings have the most strikes, but it does not include a good representation of the overall totals. How large a problem does the COD campus have? How many more strikes have occurred at the SSC than the HEC? Attempting to answer either of these questions from the pie chart would be difficult. Take a look at the Graph Choice Chart created by the Maine Data Literacy Project in order to see what other types of graphs exist and why you might choose them.
You will use this data to explain what your results mean and what implications they might have. Statistical analyses are used to decide if the hypothesis was supported or not supported. If it was not supported, are there alternate methods or tests that could be tried to gain new information? If errors occurred, explain what they were, why you think they occurred, and explain how they might be corrected or modified.
Scientific Method: Final Steps
Once the data from the experiment has been analyzed, scientists should return to their hypothesis and reach final conclusions. They will think about the following questions:
- Did the data produced from the experiment provide evidence that supported or rejected the hypothesis?
- Were there errors in the experimental design that should be corrected in future work? (For example, should the experiment be run for a shorter or longer time, or were there unexpected variables that should be controlled in future experiments?)
- What other experiments should be conducted in order to more accurately answer the research question?
Asking questions like these ensures that scientists can learn from all experiments, even those that do not run under ideal conditions, and allows scientists to continue to refine our knowledge of the world around us.
Once the experiment has been written and presented at an academic conference or published as a research paper, other scientists can review the work, and can build their own scientific experiments in response to the information presented. See Figure 1.6 below for a visual representation of this process.
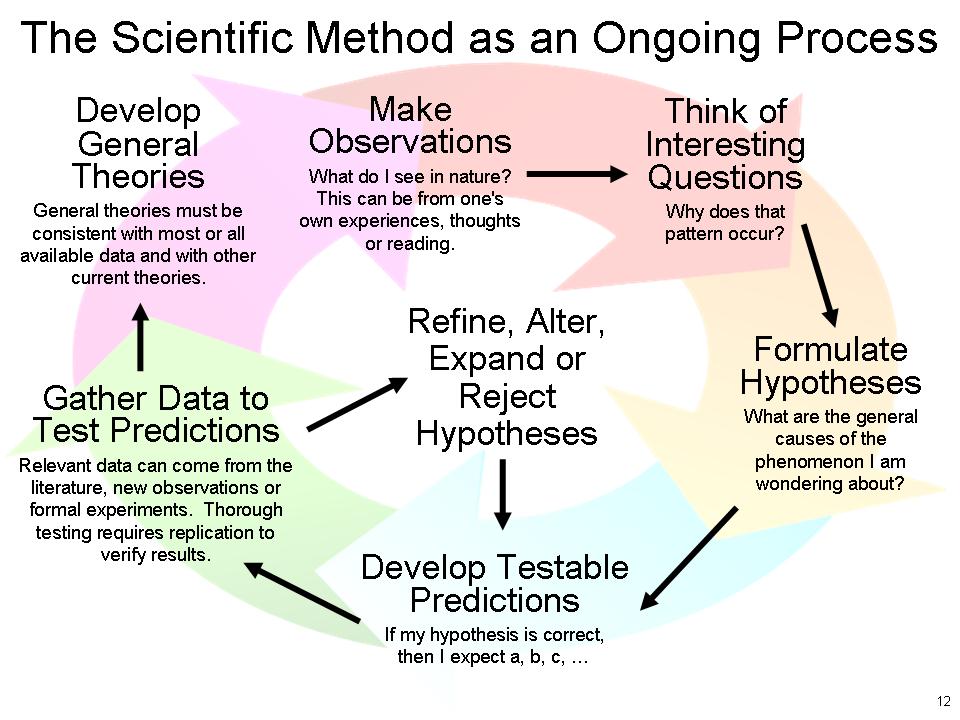
The iterative (or repeated, with improvements) nature of scientific experimentation allows us to build scientific knowledge and better to understand the world around us (in this case, the best way to prevent bird window collisions).
Lab Directions
It is now your turn to practice the skills explained in Parts 1, 2, and 3 of this lab. Go to the Lab Response Form to answer questions and complete the described activities. Refer again to information in Parts 1, 2, and 3 and be sure to seek guidance from your instructor as needed.
References
Caulfield, M. (2019, June 19). SIFT (The Four Moves). Hapgood. https://hapgood.us/2019/06/19/sift-the-four-moves/
Davidoff, J. (2024, August 14). Window Strikes Are Even Deadlier for Birds Than We Thought. Audobon. https://www.audubon.org/magazine/window-strikes-are-even-deadlier-birds-we-thought
Maine Data Literacy Project. (2016). Graph Choice Chart. Retrieved September 1, 2024, from https://tuvalabs.com/static/documents/Graph_Choice_Chart.pdf
Uribe-Morfin, P., Gomez-Martinez, M., Moreles-Abonce, L., Olvera-Arteaga, A., Shimada-Beltran, H., & MacGregor-Fors, I. (2021). The invisible enemy: Understanding bird‐window strikes through citizen science in a focal city. Ecological Research, 36(3), 430–439. https://doi.org/10.1111/1440-1703.12210
Lab 1 Response: Introduction to the Scientific Method, Information Literacy, and Data Literacy
Download this Lab Response Form as a Microsoft Word document.
Part 1: Design a Scientific Experiment
- Look at the four questions below and select one.
- Do mosquito repellent plants work?
- Are there more invasive species in the Chicago River than in Lake Michigan?
- Is plastic harmful to organisms?
- How does oil impact plant growth?
- Which question did you select?
- Identify at least three problems with the focus, measurability, comparison, or control.
- Rewrite the question so that it is an interesting, focused, and scientifically plausible question that comes from a biological perspective.
- Consult Wikipedia or a reference database from your college library about your research question listed above. Identify the article you read with a title and link.
- List 5 keywords from that source that you could use to search for focused information related to your question.
- Using at least some of the keywords you listed above, do a search and choose a source that would help you to learn more about your specific topic. Write the keywords you used, a title and link for the source you selected, and summarize the information you found helpful in it.
- Now write a possible hypothesis to answer your research question, using the If______ then _____ construction:
- Design an experiment that would produce data that supports or rejects your hypothesis. Explain what would happen in your experiment (i.e., who would conduct it, what would happen, over what length of time). Identify the independent variable, the dependent variable, and the controlled variables.
- Give one type of qualitative data and another type of quantitative data produced by the experiment you designed that could be used to support or reject the hypothesis.
Part 2: Analyzing Experimental Data
Because the experiment that you designed has not collected data, here is a sample table describing bird strikes on the COD campus by type of bird during Fall 2023.
| Type of Bird | Number of Strikes | Percentage of Total |
|
Thrush |
21 | 24% |
| Warbler | 38 | 43% |
| Robin | 7 |
8% |
| Cardinal | 2 | 2% |
| Sparrow | 11 | 13% |
| Hummingbird | 1 | 1% |
| Junco | 2 | 2% |
| Unknown | 6 | 7% |
- Using the table above, plot a bar graph showing the number of strikes by type of bird. Include the following: units of measurement (where applicable) and labels for the x and y axes. (The figure number and caption have been provided.) Make sure that your independent variable is on the x-axis and the dependent variable is on the y-axis.
- Look at the experiment that was designed to learn if decals applied randomly to windows were as effective in preventing bird strikes as those applied diagonally (found in Lab Activity 1). How could you improve the experiment as described? List three concrete ways you could improve on the experiment that would make the data more accurate in supporting or rejecting the hypothesis.
