Lab 5: Exploring the Tallgrass Prairie Ecosystem
Introduction
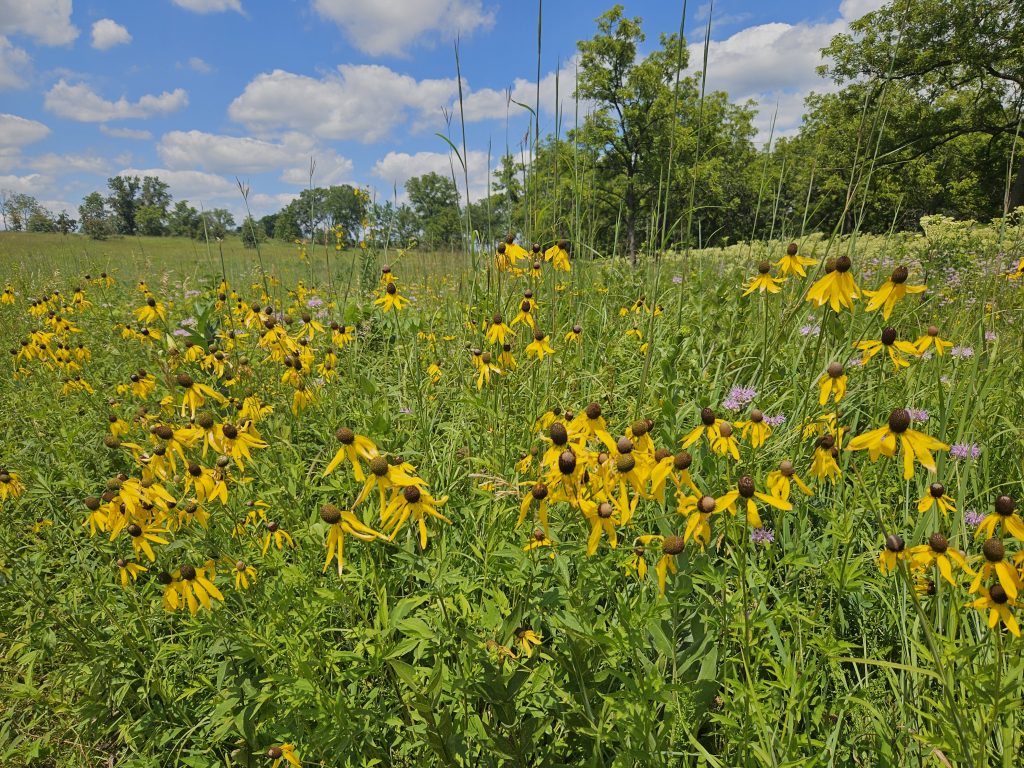
Grasslands, seas of grasses, and wildflowers (Figure 5.1) once covered much of the central part of North America. In its humid eastern areas, tallgrass prairies spread across 170 million acres of the Midwest, into parts of Canada and south to Texas (Samson and Knopf, 1994). Drought, wind, and fire relegated most shrubs and trees to moist, protected areas, such as those along rivers and smaller streams (Gleason, 1913). In Illinois, the thick bark of bur oak trees helped protect them from fire, enabling them to scatter from the edge of the forest into the tallgrass prairie, forming savanna (Gucker, 2011). Depressions on the land held water, forming wetlands or wet prairie. Animals large and small burrowed in the soil, grazed on prairie plants, or hunted other creatures throughout the prairie. As more and more people moved into the tallgrass prairie, farmed its rich soils, and built railroads and towns, the prairie and fire that sustained it rapidly disappeared (McClain et al., 2021). Today, small remnants and restorations can help us imagine and investigate the diversity of the prairie ecosystem.
Lab Objectives
In this lab, you will:
- Observe and quantify habitat characteristics of the tallgrass prairie ecosystem.
- Examine evidence of animal presence and activity in the tallgrass prairie.
- Practice nature observation skills and systematically record data.
- Analyze the composition of organisms in a tallgrass prairie.
- Evaluate the influence of the abiotic environment on organisms in the prairie.
- Compare the historical and current landscape and land use by people in the area you are studying.
- Discuss the benefits and challenges of habitat restoration in urban settings.
Ticks can be found in grasses and shrubby vegetation. Wear long sleeves and pants and check yourself carefully for ticks afterward. Check local sources for tick information and prevention.
Part 1: Habitat Characteristics
Tour the tallgrass prairie, led by your instructor or someone who works to restore tallgrass prairie ecosystems. Learn about the history of the site. At the College of DuPage, the Ecological Study Area and the Russell R. Kirt Prairie are suitable locations; the college’s Prairie and Natural Areas Manager is an excellent resource for a tour.
Directions: Recording Habitat Characteristics
Go to Part 1 of the Lab Response form. Provide your notes and sketches as indicated. On the next page, generate a labeled map of the site. Hand draw or insert a snapshot of an aerial image from Google Earth. Label the image. Include information on the site’s size (area); landforms and features—e.g., hills, flats, depressions; various habitats (e.g., prairie, wetland, woodland); proximity to buildings, roads, and other paved areas; location and length of trails. List whether the study site is a prairie remnant or the amount of time since it was replanted (restored).
Answer Questions 1-3 at the end of the Lab Response form.
Part 2: Analysis of the Plant Community
Materials
- Regional plant field guides and online resources
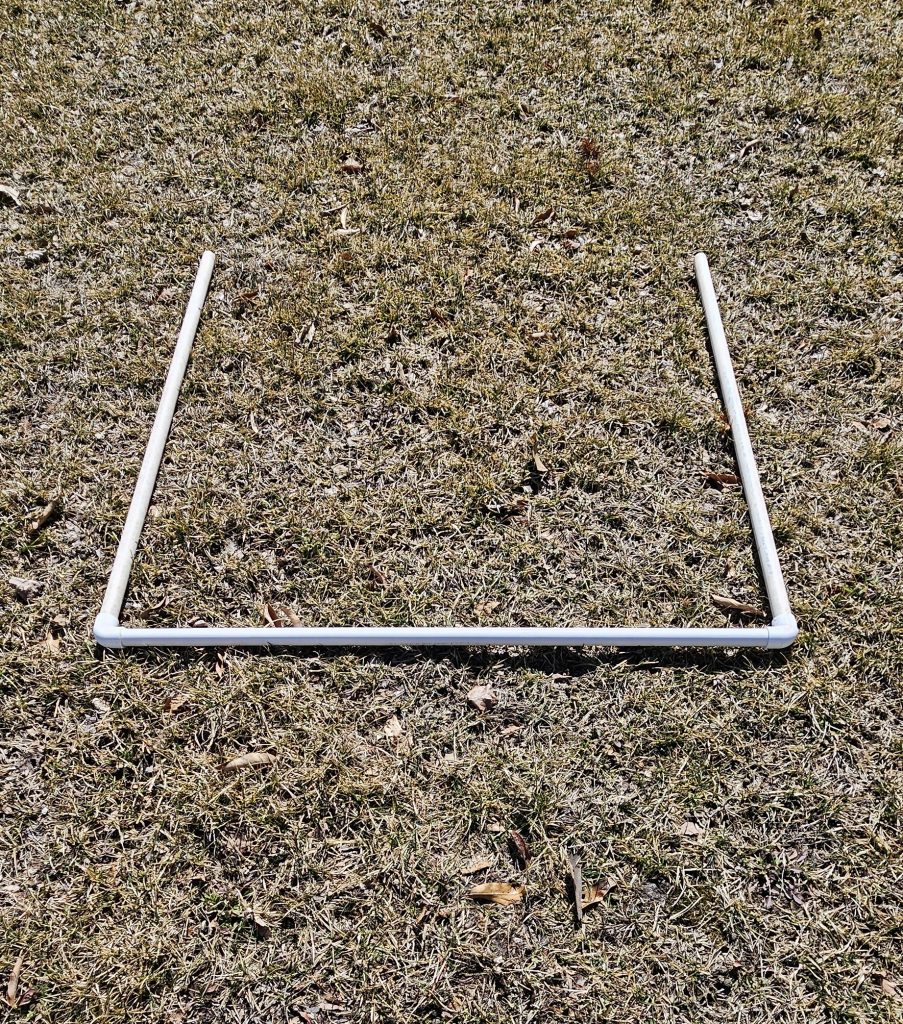
- 3-sided, 1 m2 quadrat frame made of ¾-inch (1.9 cm) diameter PVC pipes and 2 elbows
- Meter stick
- Rope or tape measure > 20m
- Wire flags
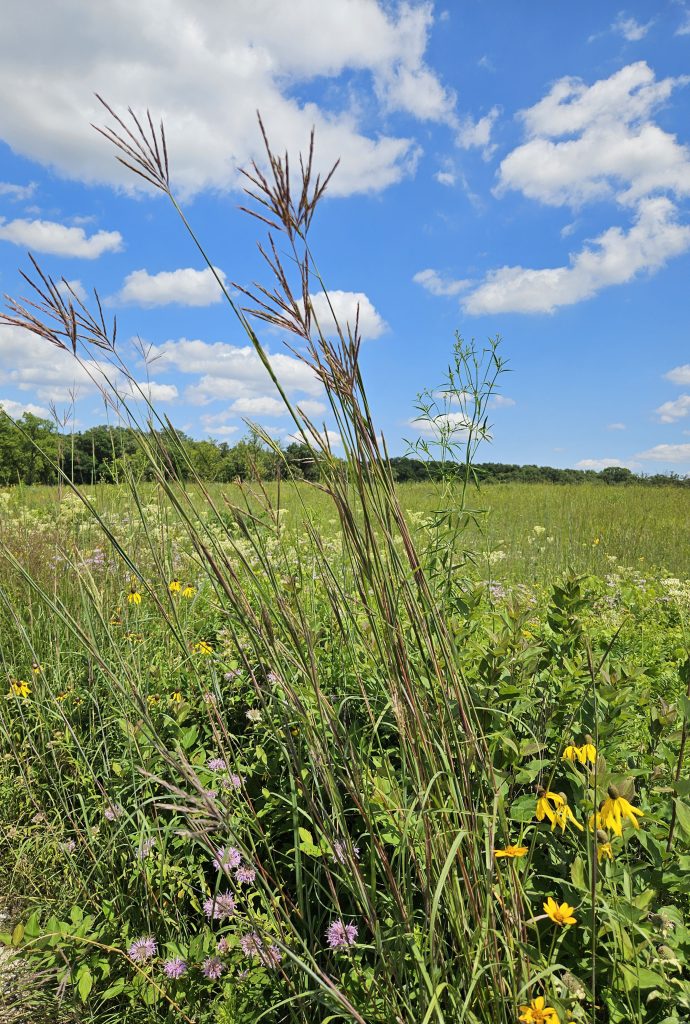
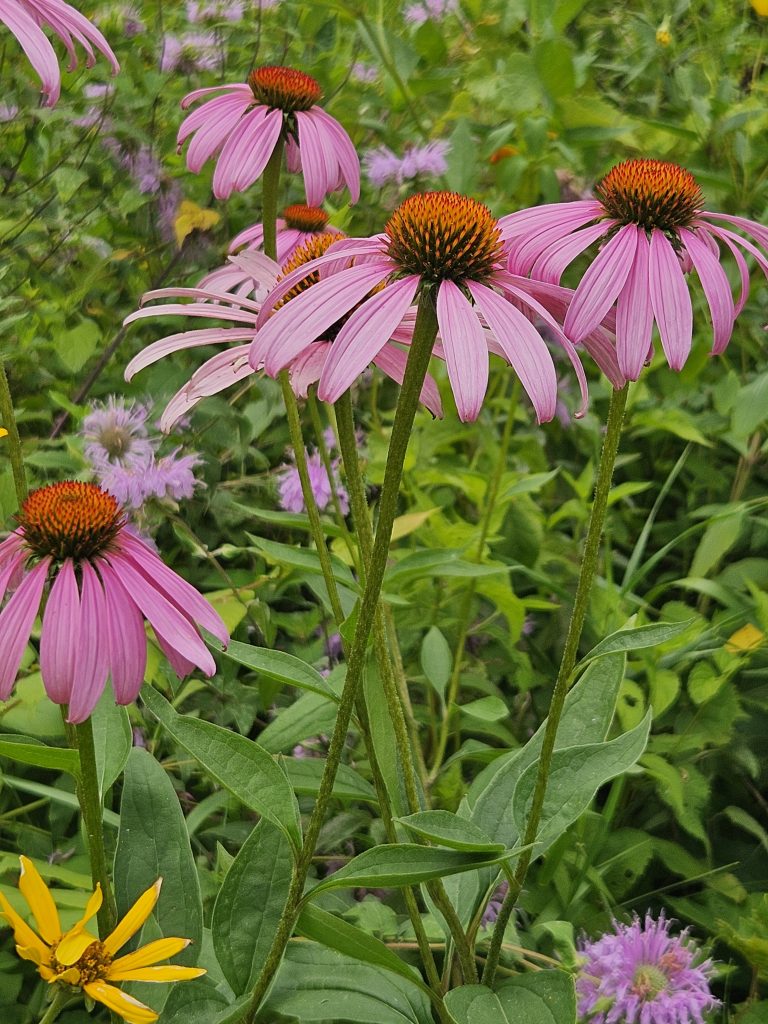
Tour the tallgrass prairie, led by your instructor or someone who works to restore tallgrass prairie ecosystems. Learn to distinguish the two groups of herbaceous plants found in prairie: grasses and forbs. Grasses belong to one plant family, Poaceae, whereas many other plant families comprise the forbs. For grasses, look for narrow, blade-like leaves emerging as a bunch from the ground or from joints on a tall, hollow stem (Figure 5.2). Flowers are present but not showy; they eventually produce grains. In contrast, forbs have solid stems that may branch. Flowers, if present, tend to be more conspicuous than those of grasses, contributing to the showy wildflowers of the prairie (Figure 5.3). Woody shrubs and young trees may occur in the area you are
sampling. They have stems with buds that survive aboveground over winter. Ask your instructor or tour guide to help in identifying any of these. Find out about any efforts to manage the woody species encountered during your tour. At the College of DuPage, invasive woody species of the prairie can include Callery Pear (Pyrus calleryana) and a couple species of Sumac (Rhus spp.).
Directions: Abundance of Prairie Grasses and Forbs
Work in small groups of students. With the assistance of your instructor or a tape measure, identify a line or transect in the prairie that is 20 m long, at least 5 m from the edge of a trail or other habitat, and at least 10 m from another group’s transect. Use your tape measure or rope to mark the transect line, then place a wire flag at 0 m, at 10 m, and at 20 m. The wire flags indicate your sampling locations for the next step.
Assemble your 3-sided PVC quadrat frame (Figure 5.4). Place the quadrat frame on the ground around the plants at the start of your transect (0 m). Use the meter stick to form the fourth side of your quadrat. Take care not to step into the quadrat frame and onto the plants within it.
Count the number of different species of grasses and forbs inside your quadrat. Make use of your field guide or online identification resources on a mobile device to distinguish different species. If possible, list the names of the species you identified. Record the number of grass and forb species for the quadrat at 0 m in Part 2 of the Lab Response Form.
Next, estimate coverage of grasses and forbs. Stand at the edge of your quadrat looking in and down at the plants. Estimate the proportion of the horizontal surface that is covered by forbs, then the percentage of the surface that is covered by grasses. Record for the quadrat at 0 m in Abundances of Grasses and Forbs on Part 2 of the Lab Response Form.
Pick up and place your quadrat frame 10 m down the transect. Repeat and record the number of grass and forb species, plus the percent cover estimates for grasses and forbs for the quadrat at 10m in Abundances of Grasses and Forbs on Part 2 of the Lab Response Form.
Pick up and place your quadrat frame 20 m down the transect. Repeat and record the number of grass and forb species, plus the percent cover estimates for grasses and forbs for the quadrat at 20 m in Abundances of Grasses and Forbs on Part 2 of the Lab Response Form.
Compare your results with those of other groups. Answer Questions 4–5 at the end of the Lab Response Form.
Directions: Presence of invasive woody plants
Walk along the same 20-meter transect you used for sampling prairie forbs and grasses. Note the presence and species of each woody stem within 1 meter of your line. With the help of your instructor or field guides, try to identify the names of the woody species encountered and whether they are native or non-native to the region. Record your counts of the woody species in Presence of invasive woody plants on Part 2 of the Lab Response Form.
Compare your results with those of other groups. Answer Questions 6–7 at the end of the Lab Response Form.
Part 3: Analysis of the Animal Community
Materials
- Rope or tape measure > 20m
- Wire flags
- Animal identification guides—online
Directions: Animal Signs Throughout the Prairie
Tour the tallgrass prairie, led by your instructor or someone who works to restore tallgrass prairie ecosystems. Learn about some of the various animals that are found at your study site and their signs, i.e., evidence of animal presence. Many animals avoid humans so searching for signs on the ground will be important. Especially look for paths, holes, digging, tracks, and scat (feces) created by animals. Record observations of animal signs that you see with your tour leader during your walk in Prairie Tour Data on Part 3 of the Lab Response Form. Take pictures with a phone camera, if possible. Insert or provide links to your images under Prairie Tour Data on Part 3 of the Lab Response Form.
Directions: Animal Observations Along a Sampling Transect
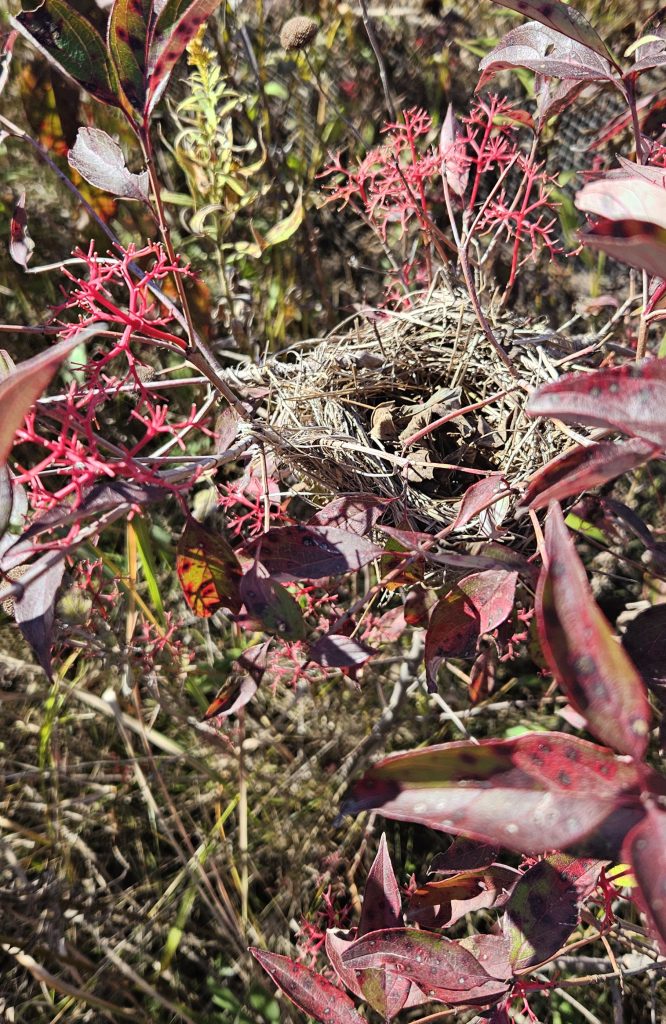
Next, observe signs and presence of invertebrate and vertebrate animals along a 20-meter transect. Follow the instructions for setting up your transect in Part 2 of this lab or use the same 20-m transect you used for sampling prairie forbs and grasses. Take pictures with a phone camera, if possible. On the ground, look for ant mounds, burrows of crayfish (holes surrounded by volcano-like mounds), runways and burrows of small mammals (such as voles), and live worms, ants, other invertebrate, and vertebrate animals (e.g., frogs and toads). In the vegetation, note the presence of insects including beetles, wasps, flies, and butterflies. Look for structures created by animals in the vegetation like spiderwebs and bird nests (Figure 5.5). Note any birds flying within 10 m on either side of your transect, taking care not to double count the same birds with nearby classmates. Record your observations and insert or link to any pictures you took under Transect Data for Part 3 of the Lab Response Form.
Compare your results with those of other groups. Answer Questions 8–10 at the end of the Lab Response Form.
Part 4: Analysis of the Abiotic Environment—Soil Characteristics
Materials
- Shovel or bulb planter tool, ca. 10-cm diameter
- Water bottle
- Plastic bag
- Soil texture flow chart
Soil texture refers to the size and density of soil particles. The particles that contribute to texture range from large pieces of gravel to relatively large sand particles, visible with the naked eye, to finer silt particles, to the smallest particle, clay. Soil that contains an even mix of each of these particles is called loam, a soil texture in which many cultivated plants grown best. That is because the presence of large particles allows air (and oxygen) to reach plant roots. Medium-sized silt aids in retaining water that can be absorbed by plant roots and used by soil microbes, while clay particles are especially important for holding nutrients that can be released for plant roots to absorb. Yet, plants and other organisms in nature may have to contend with coarser- or finer-textured soils that present challenges to water, oxygen, or nutrient availability.
Directions: Collecting Soil Samples
Work in small groups to extract a 10-cm cylindrical sample of soil, using the shovel or bulb planter tool. Ensure you are at least 10 m away from any other point where soil is being collected by your group or another group. Place the soil sample in the plastic bag to analyze in the laboratory classroom or prepare to analyze your sample in the field.
Directions: Analyzing the Texture of Soil Samples
Watch a video or instructor demonstration on using the hand or field technique to assess soil texture. Following are a couple of helpful videos on Using Field Tests to Determine Soil Texture by the UW Ecology Lab and Soil Texture by Feel by UCDavisIPO.
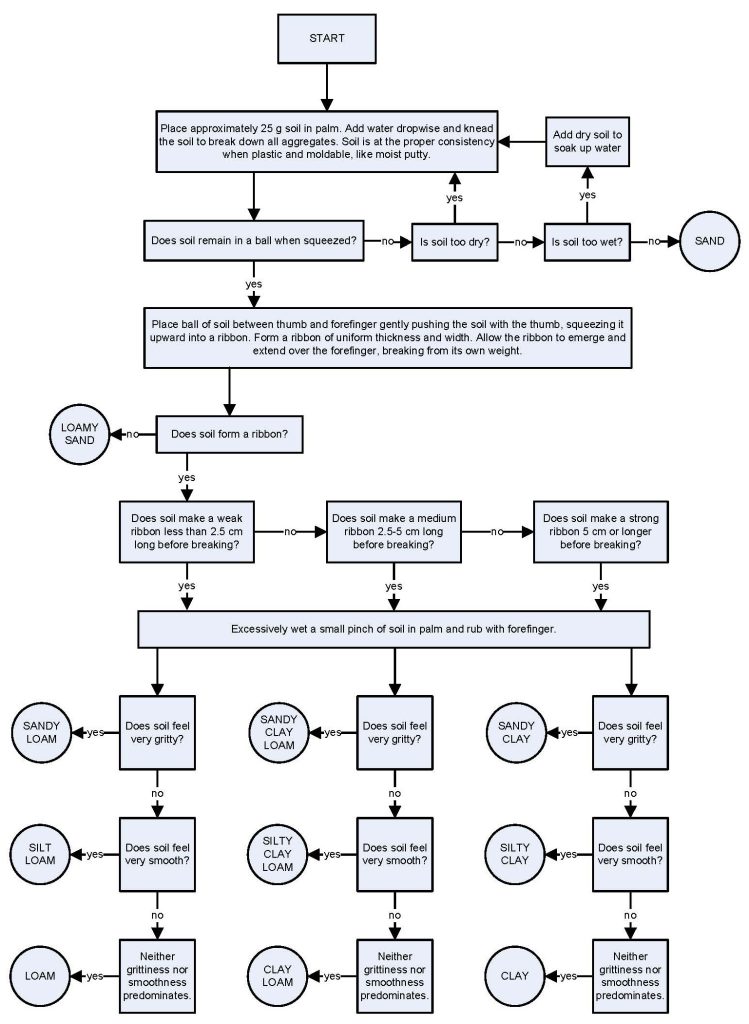
Take a palm-sized piece of soil from your sample. Refer to the soil texture flow chart (Figure 5.6). Use your water bottle to moisten the soil sample if needed. Follow the steps in the soil texture flow chart to arrive at a description of your soil texture type. Record the approximate location from where you collected your sample, habitat characteristics, weather conditions at the time of collection, and the texture type of your sample under Sample 1 in Part 4 of the Lab Response Form.
Take 3 additional samples at least 10 m from your first transect or compare your results with those of other groups. Record the data pertaining to these samples under Samples 2, 3, and 4 in Part 4 of the Lab Response Form. Answer Questions 11–13 at the end of the Lab Response Form.
References
Gucker, C. L. 2011. Quercus macrocarpa. In: Fire Effects Information System, [Online]. U.S. Department of Agriculture, Forest Service, Rocky Mountain Research Station, Fire Sciences Laboratory (Producer). Available: https://www.fs.usda.gov/database/feis/plants/tree/quemac/all.html [2024, September 6].
Gleason, H.A. 1913. The relation of forest distribution and prairie fires in the middle west. Torreya 13: 173-181.
William E. McClain, W.E., C.M. Ruffner, J.E. Ebinger, G. Spyreas. 2021. Patterns of Anthropogenic Fire within the Midwestern Tallgrass Prairie 1673–1905: Evidence from Written Accounts. Natural Areas Journal 41(4): 283-300.
Samson, F. B. and F. Knopf. 1994. Prairie Conservation in North America. BioScience, 44(6):418-421.
Lab 5 Response: Exploring the Tallgrass Prairie Ecosystem
Download this Lab Response Form as a Microsoft Word document.
Part 1: Habitat Characteristics
Notes and sketches of your study area
|
Include notes on the site’s land use history, restoration, and current features of the landscape. |
|---|
|
|
Part 1: Habitat Characteristics
Map of the study area
|
Include the study site’s area, notable habitats, trails, and other features. |
|---|
|
|
Part 2: Analysis of the Plant Community
Abundances of Grasses and Forbs
|
Observation date |
Observer name(s) |
|||||
|
Study site name, transect location |
||||||
|
Weather |
||||||
|
Recordings |
Quadrat at 0 m |
Quadrat at 10 m |
Quadrat at 20 m |
Average across quadrats |
Minimum and maximum |
|
|---|---|---|---|---|---|---|
|
Number of grass species |
|
|
|
|
|
|
|
Number of forb species |
|
|
|
|
|
|
|
% cover of grass species |
|
|
|
|
|
|
|
% cover of forb species |
|
|
|
|
|
|
Part 2: Analysis of the Plant Community
Presence of invasive woody plants
|
Number of woody stems in transect = |
|
|
Woody species name |
Number counted |
|---|---|
|
|
|
|
|
|
|
|
|
|
|
|
|
|
|
|
|
|
Part 3: Analysis of the Animal Community
Prairie tour data
|
Observation date |
Observer name(s) |
|
|
Study site name, transect location |
||
|
Weather |
||
|
Animal sign or observation (insert pictures as relevant) |
Number counted |
|
|---|---|---|
|
|
||
Part 3: Analysis of the Animal Community
Transect data for animals
| Observation date | Observer name(s) | ||||
| Study site name, transect location | |||||
| Weather | |||||
| Recordings | Quadrat at 0 m | Quadrat at 10 m | Quadrat at 20 m | Sum across quadrats | Proportion (divide sum by total) |
|---|---|---|---|---|---|
| Number of invertebrate animals seen (include descriptions, images) | |||||
| Number of invertebrate animal signs (include descriptions, images) | |||||
| Number of vertebrate animals seen (include descriptions, images) | |||||
| Number of vertebrate animal signs (include descriptions, images) | |||||
|
TOTAL of all signs and observations in the transect = (Add the sums across quadrats for TOTAL) |
|||||
Part 4: Analysis of the Abiotic Environment—Soil Characteristics
| Observation date | Observer name(s) | ||
| Study site name, transect location | |||
| Weather | |||
| Sample | Description of location and habitat characteristics | Soil texture type | |
|---|---|---|---|
| Sample 1 | |||
| Sample 2 | |||
| Sample 3 | |||
| Sample 4 | |||
Questions
Questions for Part 1 on Habitat Characteristics
- Describe the types of habitats currently present at your study site.
- Research and describe the historical land cover and land use of your study site. Decide how far back in time to go and explain this in your response. Cite the source(s) you used.
- Describe the landscape surrounding your study area. Address the presence of human and natural habitats and the challenges plants and wildlife face in colonizing these areas.
Questions for Part 2 on Plant Community
- How did the average number of grass and forb species compare to the percent cover of grass and forb species identified in your quadrat? How do these averages compare to other transects sampled in the prairie?
- Based on the quadrat data collected by the class across multiple transects, do grasses or forbs constitute the matrix (dominant or most abundant plants) of the prairie? Explain if there were any inconsistencies. Relate to similarities or differences of the prairie environment.
- Compare the data collected by the class on woody species. Describe the types of woody species encountered and where in the study site they were most common.
- Describe which of these woody species are considered invasive in the prairie and what efforts are being or will be used to manage them.
Questions for Part 3 on Animal Community
- Describe your most surprising or interesting animal-related observation.
- Looking at your data, what animal signs or observations were the most common? How do you think this relates to the abundance of certain animals in the prairie?
- Explain how time of day, the season in which you sampled, and the methods you used could influence your observations of animals and their signs. Provide suggestions for improvement.
Questions for Part 4 on Soil Characteristics
- What part/s of the soil texture analysis did you find easy to perform? Was there any part that seemed challenging? Explain how this could affect the reliability of your texture results.
- Describe the similarities and differences in texture among your soil samples. Compare the soil textures to the locations and habitat characteristics where each was collected (e.g., north vs. south side of prairie; low area vs. on a hill or slope).
- Based on your summary of soil texture and habitat, describe whether the area you sampled was mostly homogeneous (uniform) or heterogeneous (patchy). Explain how this could affect plants and animals.
