Lab 11: Investigating Food Waste Composting
Introduction
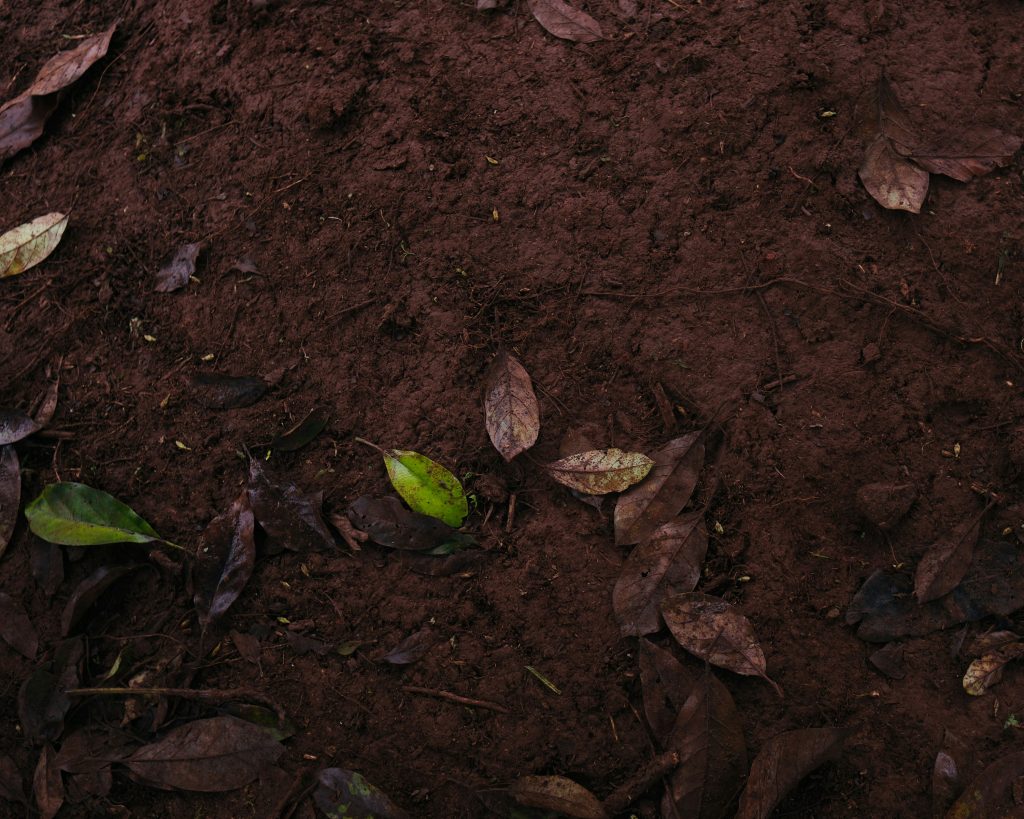
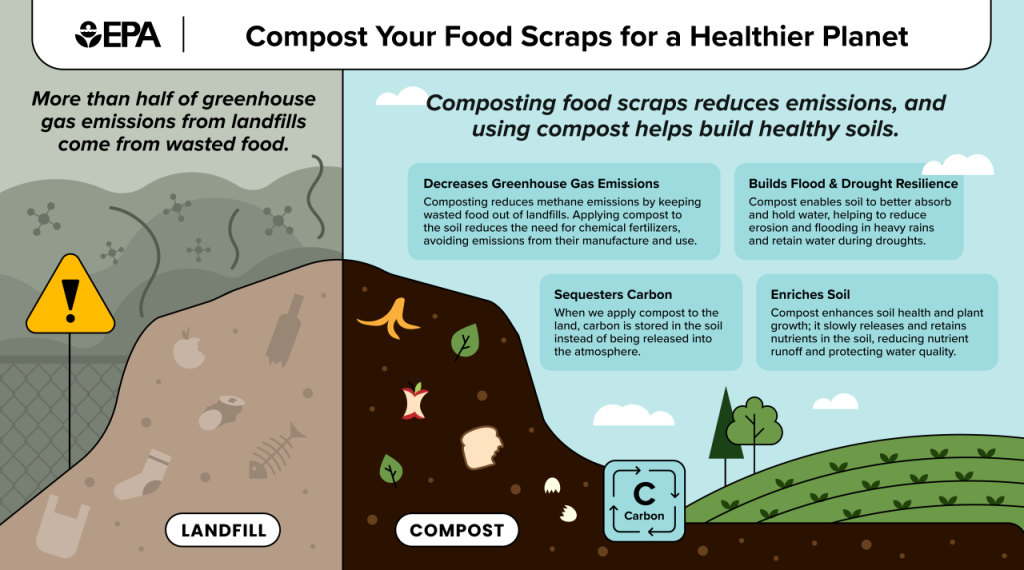
Compost is an organic-rich material, equivalent to humus, a dark, crumbly substance found in the upper layers of many soils (Figure 11.1). It is created through the decomposition of primarily plant-based materials. Many foods consumed by humans and their scraps or unused parts can be naturally recycled by composting. Compost can be used to augment farm and garden soil and be used to grow potted plants. Converting food to compost thus reduces organic waste added to landfills, with multiple benefits to our environment (Figure 11.2).
Food and yard waste to be composted may be piled outdoors or placed in bins. Effective composting generally incorporates a mix of carbon-rich, or brown materials, and nitrogen-rich, or green materials (Table 11.1). Microbial organisms like bacteria and fungi act as the decomposers that break down, use, and recycle materials and nutrients in the compost pile. These organisms release heat during decomposition and alter the chemistry, including pH, of the decomposing material.
Typical decomposers of compost require exposure to oxygen in air, moisture, and a 30:1 carbon to nitrogen ratio (Michell et al. 1999). The various items for composting may be chopped, layered, and then periodically mixed to facilitate microbial breakdown. When composting at home, some materials should not be added to the compost mix because they are resistant to decomposition, are pathogenic or toxic, or promote an increase in other organisms considered weeds or pests (Table 11.1).
In this lab activity, you will evaluate the process of decomposition and creation of compost, working in small groups in the laboratory classroom or individually at home.
|
Nitrogen-Rich Materials (“Greens”) |
Carbon-Rich Materials (“Browns”) |
Materials to Avoid |
|---|---|---|
|
|
|
*These foods can attract animals.
†Home or backyard compost piles generally do not reach high enough temperatures to fully decompose these materials.
Lab Objectives
In this lab, you will:
- Assess the biological process of composting.
- Investigate how different types of food waste decompose over time.
- Examine the impact of environmental conditions (aeration, moisture, temperature) on composting.
- Evaluate the physical and chemical changes of composting material.
Materials
- Food waste, such as fruit scraps, vegetable scraps, starchy food, protein-rich waste
- 4-5 compost containers: 2-3 liter (L) clear plastic containers
- Container lids with holes or plastic wrap and rubber bands
- Soil or mature compost for inoculum
- Thermometer
- pH meter or test strips
- Moisture meter (optional)
- Digital scale
Directions
- Consider factors important to composting. What do you want to test? What is feasible? You will now be able to generate a hypothesis. First, state the relationship between what you will compare and what you will measure, then make a specific prediction related to the rate of decomposition of your food materials. Record your hypothesis on the Lab Response Form.
- Choose food items to compost. Decide on the design of your investigation. Each container will be a unique treatment (e.g., varied foods, all or mostly “brown” foods, all or mostly “green” foods). You may also include 2 containers of varied foods and compare the amount of air/oxygen exposure (fewer holes in lids or plastic wrap covering) or vary the surface area of scraps by chopping the food contents of one container into small pieces. Consult your instructor on your proposed design of your investigation. If necessary, refine your hypothesis.
- Prepare the food items for each container and weigh them on the digital scale. Record this in Table 11.1 of the Lab Response Form. Modify Table 11.1 to suit your experimental groups. Note that aeration levels should be high unless you are manipulating this for one of your containers.
- Add 0.25–0.5 L of soil or mature compost to each container, using the same amount for each container that will contain food scraps. (The soil or mature compost serves as an inoculum, providing necessary microbes.) Decide how you will arrange your food items in the container and add them to the container. Leave approximately 2 cm of space at the top.
- Set up one container as the control by filling it only with soil or mature compost, also leaving a 2 cm space at the top.
- Secure the lid onto the container or tightly stretch plastic wrap over the top and secure with a rubber band. Punch holes in the lid for adequate aeration; remember to make significantly fewer holes in one bin with a duplicate set of contents, if comparing the effect of reduced air/oxygen exposure. (Alternatively, you may reduce the aeration of a container by not mixing it as described in step 8.)
- Store containers together under the same conditions. Place containers so that the holes at the top are exposed. Take picture(s) of your bins with the contents visible. Insert the picture(s) of your initial set-up in the Lab Response Form.
- Mix and monitor the containers weekly:
- Turn the contents to physically mix for aeration
- Record the internal and ambient temperatures
- Measure the pH and moisture of the contents
- Weigh remaining food (if separable)
- Observe qualitative characteristics of the remaining food
- Recommended: Take pictures of your containers’ contents
- Record all data in Table 11.2A-E of the Lab Response Form for a period of 6 weeks.
- Take picture(s) of your containers’ contents at the end of this investigation. Insert the picture(s) in the Lab Response Form.
- Generate a graph of your data as described on the Lab Response Form.
- Compare your results to those of other groups in your class and answer the questions in the Lab Response Form.
References
Michel, F. C., J. E. Heimlich, and H. A. J. Hoitink. 1999. Composting at Home. Ohio State University Extension. Accessed Apil 29, 2025. https://ohioline.osu.edu/factsheet/hyg-1189-99
United States Environmental Protection Agency. 2025. Composting. Accessed Apil 29, 2025. https://www.epa.gov/sustainable-management-food/composting
Lab 11 Response: Investigating Food Waste Composting
Download this Lab Response Form as a Microsoft Word document.
Name(s):
Lab Section:
Date:
Hypothesis:
|
Container ID |
Food Waste Type |
Aeration Level* |
Initial Mass of Food Items (g) |
Initial pH of Contents |
Initial Temperature (°C) of Contents |
|---|---|---|---|---|---|
|
A |
|
High |
|
|
|
|
B |
|
Low |
|
|
|
|
C |
|
High |
|
|
|
|
D |
|
High |
|
|
|
|
E (control) |
None (soil only) |
High |
|
|
|
* Keep this high for all containers except one with a duplicate food type. Alternatively, substitute Surface Area for Aeration Level. Food that was chopped will have a high surface area.
Insert image(s) of your initial set-up, showing the various containers with their contents:
Insert image(s) of the weekly or last observation(s), showing the various containers with their contents:
|
Week |
Temp (°C) |
pH |
Moisture (Low / Med / High) |
Mass of Remaining Food (g) |
Qualitative Observations (e.g., color, odor, fungal growth) |
|---|---|---|---|---|---|
|
1 |
|
|
|
|
|
|
2 |
|
|
|
|
|
|
3 |
|
|
|
|
|
|
4 |
|
|
|
|
|
|
5 |
|
|
|
|
|
|
6 |
|
|
|
|
|
|
Week |
Temp (°C) |
pH |
Moisture (Low / Med / High) |
Mass of Remaining Food (g) |
Qualitative Observations (e.g., color, odor, fungal growth) |
|---|---|---|---|---|---|
|
1 |
|
|
|
|
|
|
2 |
|
|
|
|
|
|
3 |
|
|
|
|
|
|
4 |
|
|
|
|
|
|
5 |
|
|
|
|
|
|
6 |
|
|
|
|
|
|
Week |
Temp (°C) |
pH |
Moisture (Low / Med / High) |
Mass of Remaining Food (g) |
Qualitative Observations (e.g., color, odor, fungal growth) |
|---|---|---|---|---|---|
|
1 |
|
|
|
|
|
|
2 |
|
|
|
|
|
|
3 |
|
|
|
|
|
|
4 |
|
|
|
|
|
|
5 |
|
|
|
|
|
|
6 |
|
|
|
|
|
|
Week |
Temp (°C) |
pH |
Moisture (Low / Med / High) |
Mass of Remaining Food (g) |
Qualitative Observations (e.g., color, odor, fungal growth) |
|---|---|---|---|---|---|
|
1 |
|
|
|
|
|
|
2 |
|
|
|
|
|
|
3 |
|
|
|
|
|
|
4 |
|
|
|
|
|
|
5 |
|
|
|
|
|
|
6 |
|
|
|
|
|
|
Week |
Temp (°C) |
pH |
Moisture (Low / Med / High) |
Mass of Remaining Food (g) |
Qualitative Observations (e.g., color, odor, fungal growth) |
|---|---|---|---|---|---|
|
1 |
|
|
|
|
|
|
2 |
|
|
|
|
|
|
3 |
|
|
|
|
|
|
4 |
|
|
|
|
|
|
5 |
|
|
|
|
|
|
6 |
|
|
|
|
|
Data Analysis
Calculate the % mass lost of the food for each container:
|
Container |
Food Type |
Initial Mass (g) |
Final Mass (g) |
% Mass Lost |
|---|---|---|---|---|
|
A |
|
|
|
|
|
B |
|
|
|
|
|
C |
|
|
|
|
|
D |
|
|
|
|
% mass lost = ((Initial mass – Final mass) / Initial mass) × 100
Graph
Generate and insert a line graph of the % mass lost of the food in the composting containers over time. Your graph will thus have 4 lines. Be sure to show the data points for each line, distinguish each line by a different color, provide a legend, and label the graph axes.
Optional: Also include graph(s) of pH or temperature changes of the composting material over time.
Questions
- Which food type decomposed fastest? (Briefly describe your determination of “decomposed.”) Why?
- How did differences in aeration or the surface area of food scraps affect the composting process? What qualitative or quantitative observations support your response?
- What signs of microbial activity did you observe? Relate to your qualitative (such as slimy film, fuzz, thread-like structures) and quantitative observations.
- How did pH over time compare across various composting stages?
- Did your results support your hypothesis? Explain.
- Describe how your results compared to those of others in your class.
- Synthesize and apply to nutrient cycling: Answer the following and relate to your investigation; cite any sources used:
- How does composting food waste close nutrient loops in agricultural or urban systems?
- What practices could optimize nutrient retention during the composting process?
- Reflection for action: Based on your findings, how would you modify the technique to compost your home food scraps? Investigate other methods you might use; cite your sources. What would be the best option for your household? How might you use your compost? (Also see below.)
- Optional: Visit the Fuel Garden at the College of DuPage. Observe the composting process and meet with the garden manager. Explain their composting process and how it compared to your investigation. Also describe how their compost is used and if they accept compost donations.
