Lab 4: Natural Selection of Rabbits Simulation
Introduction
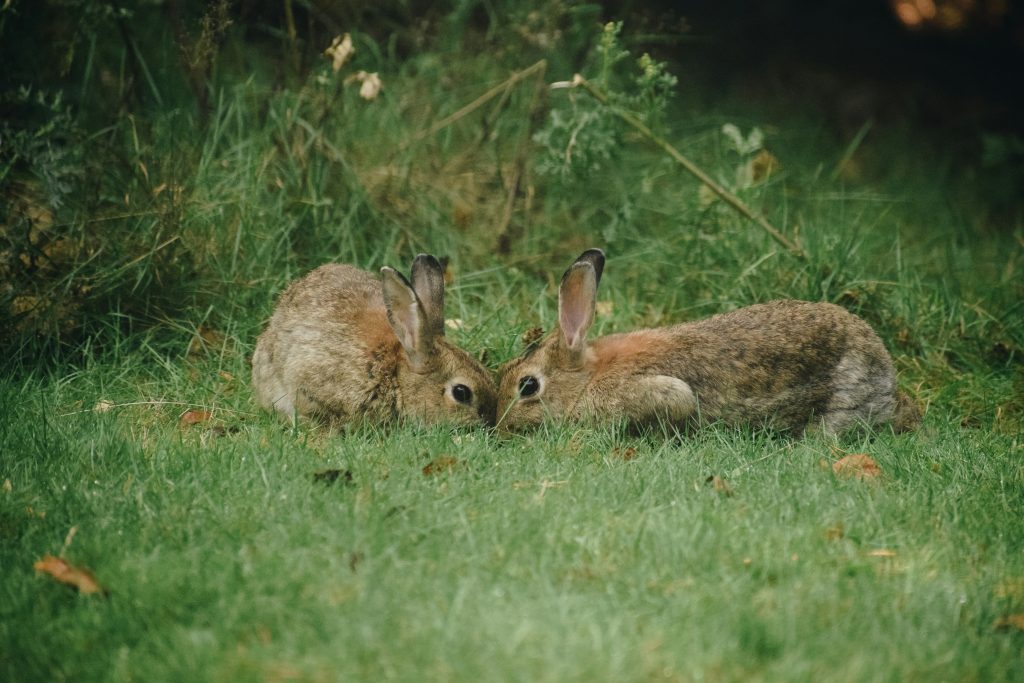
In this lab exercise, you will investigate how unique characteristics affect the survival of rabbits (Figure 4.1) in different environments and how their population changes over time. First, let’s define terms related to an organism. A character is a feature of the organism: in our case, something about the rabbits that we can see, describe, and possibly measure, e.g., fur color, type of ears, length of teeth. A trait is a variation of a character, e.g., white fur vs. brown fur.
Information for characters and their traits comes from genetic codes on an organism’s DNA. New traits arise by mutation, a change in the underlying genetic code. When an individual carries the information for two different traits, but only one can be observed, that trait and its code is considered dominant. The code and trait that is only visible when a dominant code is not present is called recessive.
Genetics deals with patterns and mechanisms of inheritance. It can be used to predict the traits of parents’ offspring or describe changes in the traits over time among a group of interbreeding individuals, called a population. The proportion of individuals with a certain trait in a population can change from one generation to the next due to random events or due to some type of selective pressure or agent in the organism’s environment, in which a certain trait becomes more favorable. The latter describes the process of natural selection, an evolutionary process we will explore in this lab exercise.
All parts of this lab exercise will use the Natural Selection Simulation by PhET Interactive Simulations, University of Colorado Boulder, licensed under CC-BY-4.0.
Lab Objectives
In this lab, you will:
- Describe how different traits change the survivability of an organism in various environments.
- Determine the correlation between certain selective pressures and traits in a population of rabbits.
- Experiment with environments that produce stable populations of rabbits, populations that die out, and populations that take over the world.
- Understand how introduced species and predator removals can disrupt populations and ecosystems.
Part 1: Factors Limiting Rabbit Populations
In these activities, you will simulate the growth of a rabbit population to understand the role of limiting factors, selective pressure, and variation in the persistence of a population.
This activity adapted from Houston, M. (2021). Rabbit Lab Population Change and Growth. PhET Interactive Simulations.
- Navigate to Natural Selection by PhET Interactive Simulations
- Click on the Intro button. Familiarize yourself with the options on the screen (Figure 4.2). Note that the simulation starts off with only one rabbit. When you Add a Mate, the two rabbits will start to reproduce.
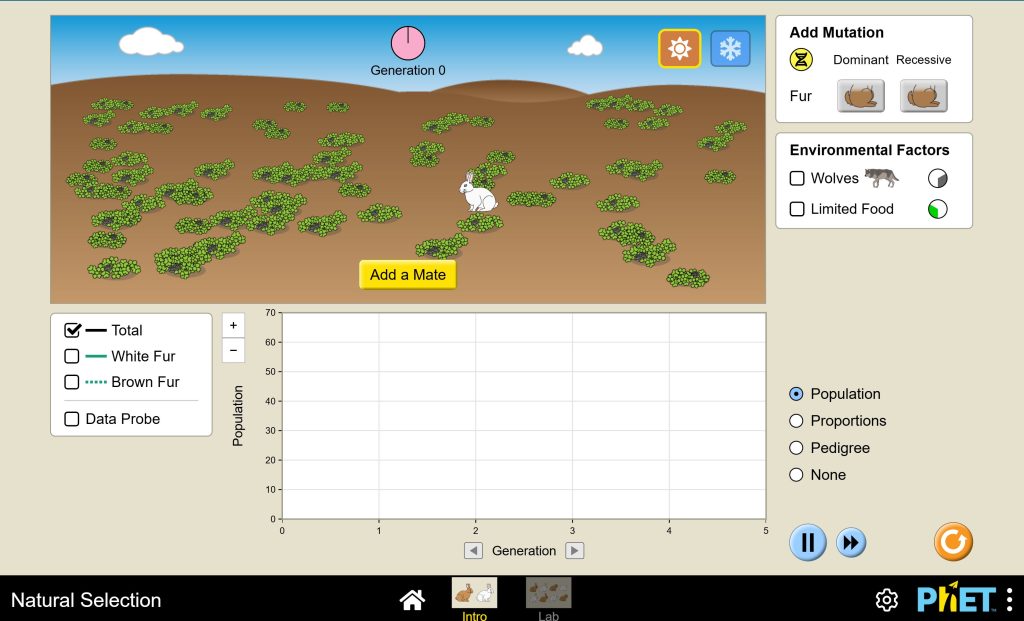
- Press the play button at the bottom right of the screen (if needed—this blue button toggles between play and pause settings), then click Add a Mate. Click on Data Probe. It will allow you to get specific population numbers from the graph. Let the simulation run for 10 generations, if possible. In Table 4.1 of the Lab Response form, record the number of rabbits at the start of each generation. Pressing and holding the fast forward button will speed up the process.
- Press the reset button (orange circle with circle arrow) then Add a Mate. Click on Limited Food. In Table 4.1 of the Lab Response form, record the number of rabbits at the start of each generation.
- Press reset button then Add a Mate. After the fourth generation, click on Wolves. In Table 4.1 of the Lab Response form, record the number of rabbits at the start of each generation.
- Press reset button then Add a Mate. Under Add Mutation, select the brown fur image under Recessive. After the fourth generation, click on Wolves. In Table 4.1 of the Lab Response form, record the number of rabbits at the start of each generation.
- Graph your data from Part 1 of the Lab Response form and answer the questions that follow. Your instructor may ask you to submit screenshots of your work.
Part 2: Mutations That Matter: More Explorations of Natural Selection
You will work with additional mutations in rabbits and environmental factors in this lab program. In addition to fur color, there are ear and teeth mutations of rabbits. For the selective agents or factors in the environment, there are options for wolves, tough food, and limited food. There are also two different environments to choose from.
- Navigate to Natural Selection by PhET Interactive Simulations
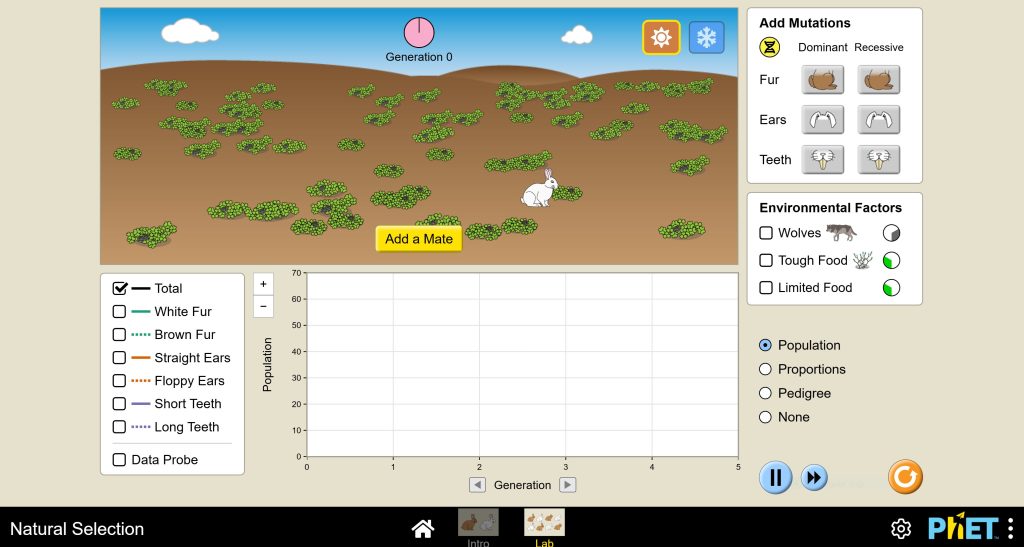
- Click on the Lab button. Familiarize yourself with the options on the screen (Figure 4.3). The Sun symbol will simulate a summer environment, while the Snowflake button will simulate a winter environment. Ear traits, straight or floppy, and teeth length (of incisors), short or long, are new traits to consider. As before, the simulation starts you off with only one rabbit. When you Add a Mate, the two rabbits will start to reproduce.
- Refer to Table 4.2 in Part 2 of the Lab Response form. The row headers refer to each selective agent or set of environmental factors that you will manipulate, one row at a time. The column headers, to the right of Total Rabbits, list the rabbit traits that you will keep track of. The cells of the table are where you will enter your data on the number of rabbits after 10 generations (or earlier if rabbits die out or take over the world before then).
- Begin by selecting the Sun symbol for Summer, Add a Mate, then select Floppy Ears under Recessive in the Add Mutation box. Check Total, Straight Ears, and Floppy Ears in the box next to the graph. Press the play arrow (if toggled to pause) to start the simulation. At generation 4, add Wolves.
- Use the Data Probe (check it in the box to the left of the graph) to obtain the number of rabbits at 10 generations or at the end, if the simulation stopped earlier. Record this number in the appropriate cell of Table 4.2 in Part 2 of the Lab Response form.
- Reset the simulation, select the Snowflake for Winter, and repeat the rest of step 4: add a mate, select recessive floppy ears, and then add wolves at generation 4. Record number of rabbits at 10 generations, if possible, in the appropriate cell of Table 4.2 in Part 2 of the Lab Response form.
- Reset the simulation, select the Sun symbol for Summer, Add a Mate, then select Long Teeth under Recessive in the Add Mutation box. Check Total, Straight Ears, and Floppy Ears in the box next to the graph. Press the play button (if toggled to pause) to start the simulation. At generation 4, add Wolves. As before, find then record the number of rabbits in the appropriate cell of Table 4.2 in Part 2 of the Lab Response form.
- Reset and select the appropriate boxes to test the other simulations that combine seasons with one of the other selective agents in the environment. Note that Tough Food and Limited Food get added before starting the simulation, while wolves get added at the 4th generation of rabbits. Ear type and tooth length will be manipulated separately from one another. Complete Table 4.2 in Part 2 of the Lab Response form and answer the questions that follow.
Your Own Experiment
Optional: Test predictions on combinations of environmental factors and mutations that you have not yet tested. Hypothesize then test your predicted outcomes. Record your Hypothesis, Results, and Conclusions in Part 2 of the Lab Response form.
Hypothesis: Describe the variables you will test. Predict what you think will happen with the rabbit population by the 10th generation and why.
Results: Run your simulation and report the number of rabbits at the 10th generation. If the simulation ended earlier, note the generation at which the simulation ended and explain if the rabbits died out or took over the world. Also describe the pattern of population change for the different mutations. Ideally, conduct and record the results for several runs, resetting between each run.
Conclusion: Explain why you think this particular outcome occurred for your rabbit population. Use your previous results as a comparison.
Part 3: Rabbit Invasion: Linking Your Lab to Lessons from the Real World
People have introduced organisms from one part of the world to another, often with devastating consequences to the ecosystems in which they were introduced. Read about the history of European rabbit introductions to Australia (Almeroth-Williams 2022).
Answer the questions in Part 3 of the Lab Response form.
References
Almeroth-Williams, T. (2022, August 22). DNA profiling solves Australian rabbit plague puzzle. University of Cambridge: Stories. https://www.cam.ac.uk/stories/dna-profiling-solves-australia-rabbit-plague-puzzle
Houston, M. (2021). Rabbit Lab Population Change and Growth. PhET Interactive Simulations. https://phet.colorado.edu/en/activities/6693
Simulation by PhET Interactive Simulations, University of Colorado Boulder, licensed under CC-BY-4.0 (https://phet.colorado.edu).
Lab 4 Response: Natural Selection of Rabbits Simulation
Download this Lab Response Form as a Microsoft Word document.
Part 1: Factors Limiting Rabbit Populations
|
Generation number |
No Limiting Factors |
Limiting Factor: Food |
Limiting Factor: Wolves |
Limiting Factor: Wolves (with different rabbit fur color traits) |
|---|---|---|---|---|
|
1 |
|
|
|
|
|
2 |
|
|
|
|
|
3 |
|
|
|
|
|
4 |
|
|
|
|
|
5 |
|
|
|
|
|
6 |
|
|
|
|
|
7 |
|
|
|
|
|
8 |
|
|
|
|
|
9 |
|
|
|
|
|
10 |
|
|
|
|
Graph the data from your table. Use the templates below, one for each simulation of limiting factors. The graph should be a line graph in which you show your data points, connected by a line that passes through each point. The horizontal axis (x-axis) displays the generation. (Some simulations may end, i.e., rabbits die out, before reaching 10 generations.) The vertical axis (y-axis) will display the number of rabbits. Choose a range of values that encompass your data and be sure the intervals are consistent. Label both of the axes, i.e., provide a title for each axis.
Alternatively, you may insert a computer-generated graph, following the same criteria as the manually generated graphs. (Optional: plot each of the 4 lines on 1 graph; use different symbols or colors to distinguish each plot and provide a legend.)

Part 1 Questions
- Compare the white-fur-only rabbit population with no limiting factor and with limited food. What were the ending population sizes? Explain the shape of each curve and relate your results to what you learned about population growth patterns from your textbook.
- Compare the white-fur rabbit populations with no limiting factor and with wolves. What were the ending population sizes? Explain the shape of each curve and relate your results to what you learned about population growth patterns in your textbook.
- Compare the two rabbit populations exposed to wolves: the one with both white and brown fur to the one with only white fur. Did either one of them overpopulate? Die out? Why?
- Summarize the simulated selective pressures of food availability (limited food) and wolves on the rabbit populations. Describe any differences between the white-fur-only population and the population with mixed fur colors when they were exposed to wolves.
Part 2: Mutations That Matter
|
Total Rabbits |
Straight Ears |
Floppy Ears |
Short Teeth |
Long Teeth |
|
|---|---|---|---|---|---|
|
Wolves in Summer |
|
|
|
|
|
|
Wolves in Winter |
|
|
|
|
|
|
Tough Food in Summer |
|
|
|
|
|
|
Tough Food in Winter |
|
|
|
|
|
|
Limited Food in Summer |
|
|
|
|
|
|
Limited Food in Winter |
|
|
|
|
|
Part 2 Questions
- How did seasons affect the survivorship of rabbits in the presence of wolves? Why?
- Did floppy ears appear to affect the survival and overall population growth of rabbits? Explain.
- Were long teeth advantageous to rabbits? If so, under what conditions?
- Which environmental factors were the selective agents (directly affected the survivorship of rabbits)? Which factors played an indirect role?
- Connect your findings to the roles of mutation, variation, and adaptation in a population. Explain how natural selection was demonstrated.
Part 2: Your Own Experiment
- Hypothesis:
- Results:
- Conclusion:
Part 3: Rabbit Invasion
- In what year was the source of invasive rabbits brought to Australia?
- How many rabbits in total served as the source of the invasion? Of those, how many were wild rabbits?
- Describe how environmental and genetic factors played a role in the successful invasion of rabbits in Australia. Which factor appeared to have a greater impact?
- Compare your simulations with the real-life invasion of rabbits in Australia. Describe similarities and differences.
- The source you just used was a popular article that summarized and referenced a peer-reviewed scientific (scholarly) article. Provide the citation for this scientific article and compare it to the popular article. Explain, in general, what “peer-reviewed” means, then include some specific differences in the way these two articles present the findings of the scientific investigation.
- With guidance from your instructor or a Library Research Guide, find another popular or scholarly article about a different local invasive species. Summarize information on the species and habitat(s) it has invaded, its impact on the ecosystem, and what, if any, mitigations are being used or attempted. Be sure to cite and describe how you found your source(s).
