5 Exploring Membrane Transport in Animals and Simulated Cells
Download this lab as a Microsoft Word document.
Download the lab response form (Microsoft Word document) to access the questions only.
Purpose
To analyze the effect of solute concentration on the rate of diffusion in animals and simulated cells.
Learning Objectives
At the conclusion of this exercise, students will be able to:
- Measure the rate of diffusion across the cutaneous membrane of blackworms.
- Investigate the effect of concentration on the rate of change in pulse rate.
- Predict the net direction of solute and water movement via concentration gradients in simulated cells.
Why It’s Relevant
For cells to survive, nutrients and wastes must move across the cell membrane. Factors such as temperature and concentration influence the rate of diffusion. The efficiency of this process affects how well cells absorb nutrients, eliminate waste, and maintain overall function in organisms. If membrane transport is disrupted, cells may starve or accumulate toxins, which can be fatal. This is why humans must carefully regulate their salt and water intake—imbalances can interfere with membrane transport and lead to conditions like hypertension or hyponatremia.
Introduction
Every life-form must exchange nutrients and wastes with its surroundings to survive. These exchanges are facilitated by cell membranes. Cell membranes mediate the flow of traffic between cells and the environment based on local environmental conditions. Transported substances can move by passive or active transport.
Passive transport occurs when substances able to cross the membrane are higher on one side than the other, creating a concentration gradient. The area where particles are in greater number relative to the volume of solvent is said to be more concentrated. A higher concentration operates like a crowded room, where random motion among particles tends to lead them toward the less concentrated side of the membrane until equilibrium is reached. Diffusion is one form of passive transport. Diffusion is involved in the absorption of nutrients, excretion of wastes, and even targeted drug delivery in many animals. For example, in humans, transdermal drug delivery is an approach medical professionals use to passively import chemicals into your body through the skin. Recent studies have also shown that chemicals from sunscreen, tattoos, and hand sanitizer can inadvertently enter the body through the skin (Jiang, 1999; Ines, 2017; Brewer, 2020). This process is also responsible for transporting substances in and out of the bodies of organisms living in every habitat imaginable.
Active transport does the opposite of passive transport by moving substances from areas where they are lower in number to areas of higher concentration. Since active transport opposes the gradient, an input of energy is required. Both active and passive transport mechanisms are important to life.
Single-celled organisms, such as prokaryotic bacteria and archaea, as well as most eukaryotic protists, use active and passive transport mechanisms to exchange materials directly with their environment. Multicellular organisms, such as eukaryotic plants, animals, and fungi, may use these mechanisms for direct exchange with the environment as well as between body tissues and cells. The concentration of compounds in the environment and the body plays a major role in the health and survival of different forms of life.
In this lab, you will measure the effect of concentration of a lipid-soluble drug on the rate of diffusion through the observation of changes in pulse rate of the blackworm, Lumbriculus variegatus.
Blackworms (Lumbriculus variegatus)
Blackworms (Lumbriculus variegatus) are found in shallow freshwater environments throughout North America and Europe. They prefer living along the edges of aquatic habitats such as marshes, ponds, and lakes, where they forage for food within decaying vegetation. Like most segmented worms, L. variegatus is capable of both sexual and asexual reproduction. During asexual reproduction, the worm divides into two or more fragments, then grows a new head or tail in a process called fragmentation and regeneration. Injured worms can be easily regenerated by placing them in a separate pool.
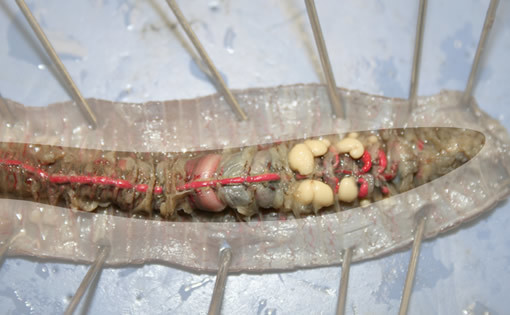
Blackworms are animals just like you, but they belong to the phylum Annelida (segmented worms). These small organisms share many characteristics with humans, such as having a cutaneous membrane (skin), a complex nervous system, and a closed circulatory system. Akin to blood flowing through your body, blackworm circulation occurs in a continuous loop where blood remains in vessels as it is quickly transported around the body, exchanging nutrients and wastes along the way. Regular muscle contractions of the dorsal blood vessel keep blood moving from the site of gas exchange at the posterior (tail) end to the anterior (head) end (Figure 5.1). A system of capillaries allows diffusion to facilitate the exchange of materials between blood vessels and surrounding tissues, while the non-contractile ventral blood vessel carries blood back to the posterior region. In response to metabolic demands, blackworms can control the number of dorsal vessel muscular contractions per unit of time, a value known as its pulse rate. In blackworms, the dorsal blood vessel works like the human heart, where a drug like caffeine would increase the pulse rate and alcohol would decrease it. By exposing worms to different drugs, you will be able to measure both the effect of each drug on the rate of contraction and how long it takes for a change in contraction rate to take place.
Changes in pulse rate can be easily viewed because the cutaneous membrane and cuticle of L. variegatus are transparent. In this lab, you will investigate the effect of drug concentration on the pulse rate in L. variegatus worms. You will measure the rate of diffusion by observing the time it takes for the pulse rate to change. The methods in this lab have been loosely adapted from work authored by (Bohrer, 2006) and (Ryan, 2017) to investigate factors affecting the rate of membrane transport.
Develop a Hypothesis
In this lab, you will measure the time it takes for hydrophobic drugs of varying concentrations to change the pulse rate of blackworms (transition from baseline to abnormal). Your instructor may also have you compare the rate of change in pulse rate after exposure to a hydrophilic drug.
Start by making some predictions.
- Prediction #1. What effect will drug X (i.e., ethanol, caffeine) have on the pulse rate in blackworms? Explain the rationale for your prediction.
- Prediction #2. How will drug concentration influence the change in pulse rate? Explain the rationale for your prediction.
Materials
Safety Warning: This lab utilizes hazardous materials. Be sure to follow your instructor’s direction on wearing proper personal protective equipment and disposal procedures. The Biology Department Laboratory Safety Practices must be followed.
- Capillary tubes
- 1.0 mM caffeine
- 5.0 mM caffeine
- 0.5 M ethanol
- 1.0 M ethanol
- Microscope
- Petri dishes or clear bowls
- California Blackworms (Lumbriculus variegatus)
- Timer
Procedure
Part A. Determining the pulse rate baseline
- Select a worm with a healthy appearance (thick worms are better than thin) to use as your test subject and transfer it to a bowl of clean, spring water using a plastic transfer pipette.
- After returning to your lab bench, carefully transfer the worm from the bowl into a piece of capillary tubing by gently squirting the worm into the capillary at a 45-degree angle. This may take a few tries, but don’t give up! Worms within the tubing will be much easier to view under the microscope. Once successfully transferred, allow a few minutes for your worm to calm down. If you injure the worm, return it to the recovery bowl and obtain a new one.
- Place the capillary tubing on the stage of your compound light microscope. Focus using the broad field objective lens under low light. Avoid intense exposure to light for extended periods. You may opt to turn the lamp off between measurement intervals.
- Locate pulsating blood in the dorsal blood vessel at about the halfway point of the worm. Be sure to use the same segment for repeated measurements.
- Count the number of pulsations for a full minute. Record 5 measurements in Table 5.1 and calculate the average and standard deviation.
- Write your average on the board, then calculate the class average. Record your values on the response form question 3.
Part B. Determining change in pulse rate
The change in pulse rate is how long it takes for the baseline pulse rate to deviate from normal. This will serve as an indirect measurement of the rate of diffusion.
- Obtain a treatment solution from your instructor. Be sure to write down the concentration of the test solution.
- Place 3 mL of the solution in a Petri dish.
- Transfer the worm to the solution in the Petri dish (without diluting the test solution), then transfer the worm, along with the test solution, into a capillary tube.
- Record any behavioral changes exhibited by your worm in Table 5.2 of the response form.
- Place the capillary tubing on the stage of your compound light microscope. Focus using the broad field objective lens under low light. Avoid intense exposure to light for extended periods. You may opt to turn the lamp off between measurement intervals.
- Locate pulsating blood in the dorsal blood vessel at about the halfway point of the worm. Be sure to use the same segment for repeated measurements.
- Observe the dorsal blood vessel for 21-27 minutes at 3-minute intervals. You may alternate observers based on the number of members in your group to ease eye strain.
- Keep track of the pulse rate until you notice a change that is consistent for 2-3 intervals.
- Calculate the amount of time it took for the pulse rate to change from baseline to abnormal. Record your response in question 4 of the response form.
- Compare your abnormal pulse rate to the baseline averages calculated in part A.
- Plot the change in pulse rate using a line graph by placing pulse rate on the y-axis and time interval on the x-axis. Identify the independent and dependent variable on your graph.
- Record your change in pulse rate on the board, so the class average can be calculated for groups using the same drug solution, then record all values in question 6 of the report form.
- Compare the pulse rate for different concentrations of various drug solutions. Respond to the summary questions on the response form.
- For a multi-group study, each table can be given a different concentration/drug to investigate.
| Trial # | Pulse/minute |
|---|---|
|
Trial 1 |
|
|
Trial 2 |
|
|
Trial 3 |
|
|
Trial 4 |
|
|
Trial 5 |
|
|
Group Average |
|
|
Standard Deviation |
|
|
Class Average |
|
|
Liquid |
Behaviors |
|---|---|
|
Spring Water |
|
|
Test Solution |
|
Summary Questions
- Which drug produced the fastest pulse relapse time? Why?
- Did drug concentration impact the pulse rate relapse time? Explain.
- Did these experiments have a control group? If yes, describe the control. If not, design an appropriate control for this experiment.
- What does the change in pulse rate data represent in terms of diffusion?
- Did you observe a change in pulse rate at different concentrations?
- How could these experiments be improved?
- What other chemicals might affect pulse rate?
- What other factors influence the rate of diffusion that could potentially impact the pulse rate of L. variegatus?
- Design an experiment that investigates another factor that influences the rate of diffusion and pulse rate in black worms.
- Did the data support your predictions? Why or why not?
- Which chemical had the fastest rate of diffusion?
Alternate Procedure for Online Courses
Part A: Observing Diffusion in Simulated Cells
Objective
Observe passive transport across a simulated cell membrane.
Introduction
In this lab, you will use a cellophane bag (commonly used to hold candy) to simulate the function of the cell membrane of organisms. You will make observations regarding the effect of particle size on diffusion across a semipermeable membrane. Iodine is an indicator that allows you to visually detect the presence of starch. When iodine is mixed with starch, the solution changes to a dark purple color.
Materials
- Iodine
- Cornstarch
- Small cellophane bag
- 8 oz. drinking cup
- Measuring cups
Procedure
- Fill a cellophane bag with a teaspoon of cornstarch and ½ cup of water, then close the bag.
- Fill a drinking cup halfway with water, then add twenty drops of iodine. Iodine and starch react to produce a dark purple color.
- Submerge the sealed cellophane bag containing cornstarch in the iodine water mixture within the cup.
- Wait fifteen minutes and record your observations in Table 5.3.
- Circle the correct answers below while you wait.
Questions
- Where is the starch concentration higher? [cup/bag].
- Where is the iodine concentration higher? [cup/bag].
- Regarding iodine, which is hypertonic? [cup/bag]. Explain your reasoning.
- Regarding starch, which is hypertonic? [cup/bag]. Explain your reasoning.
Predictions
- If the bag is permeable to starch, then starch should move [into bag/out of bag/no change]
- If the bag is permeable to iodine, then iodine should move [into bag/out of bag/no change]
- If the bag is permeable to iodine, then after 15 minutes the color of its contents will appear [orange/purple/no change]
- If the bag is permeable to iodine, then after 15 minutes the color of the solution in the cup outside the bag will appear [orange/purple/no change]
- If the bag is permeable to starch, then after 15 minutes the color of its contents will appear [orange/purple/no change]
- If the bag is permeable to starch, then after 15 minutes, the color of the solution in the cup outside the bag will appear [orange/purple/no change]
Post-Observation Analysis
|
Solution |
Starting color | Color after 15 minutes |
|---|---|---|
|
Solution in cup |
|
|
|
Solution in bag |
|
|
- Based on your observations, which substance moved?
- What evidence can you use to support this claim?
- The cellophane bag was permeable to which substance(s)?
- Explain how the bag is a model for a cell.
- Sketch the cup and bag. Use arrows to illustrate how diffusion occurred.
- What would happen if you did an experiment in which the iodine solution was placed in the bag and the starch solution was placed in the beaker? Use as much detail as possible in your explanation.
- Research the difference between the structure and size of the particles used in this investigation. Explain why some substances can cross the cell membrane while others cannot.
- What do the results of this investigation indicate about passive transport in living organisms?
Part B: Design an Experiment to Investigate Passive Transport in Simulated Cells
Objective
To investigate factors that influence the rate of diffusion (i.e., concentration or temperature).
Developing Research Questions
Consider your observations of diffusion occurring through the cellophane bag in part A. Now, think about additional factors that could affect this transport. Design a hands-on experiment to explore how certain variables influence diffusion, using cellophane bags as artificial membranes. You might investigate how the concentration of a solution or the temperature affects the rate of diffusion. Use these ideas to form a clear research question and hypothesis. Conduct an experiment to collect data that will help support or refute your hypothesis using Table 5.4 and Table 5.5 as a guide.
Examples of testable research questions:
- What is the effect of temperature on the rate of diffusion across a semi-permeable membrane?
- What is the effect of solute concentration on the rate of diffusion across a semi-permeable membrane?
Now, write your own question:
Writing Hypotheses
Based on your question above, write a simple hypothesis (possible answers to your question) about your experiment.
Hypothesis:
Designing an experiment
Think about the materials you will need to run your experiment. Make a list of items and cross-reference it with the suggested materials list provided below.
If you are investigating solution concentration, write the concentrations of the solutions you decide to test below. Be sure to include a control solution for comparison.
Solution:
Glucose ____%
Cornstarch: ____%
If you are investigating temperature, establish three temperature-controlled environments, including: room temperature, cool (2°C), and warm (select a target temperature and heat the solution before placing it in the cellophane bag)
Detection:
Iodine tests for starch—a positive test is a dark blue to black color change
Glucose test strips for the presence of glucose—a positive test shows a dark green color on the test strip
Use the template above to help you design your experiment. Decide what solution concentrations or temperatures you will investigate. Write a brief statement of your design below.
Keep the following questions in mind:
- What are you using as a control group?
- What are you using as your experimental group?
- What is your independent variable?
- What is your dependent variable?
Suggested Materials
- Iodine
- Cornstarch
- Glucose liquid shot
- Diabetic test strips (glucose test strips)
- Drinking straw (for use as a thumb pipette)
- Cellophane bag (candy bags work well)
- 8 fluid ounce cup
- Solutions of varying concentration (based on your experimental design)
- Temperature-controlled spaces (if investigating the effect of temperature on the rate of diffusion)
- Iodine
- Timer
- Distilled water
Procedure
Write a detailed description of your own methods or write the details of the timed detection method using Table 5.4 and Table 5.5 as a guide, then complete the tables and graph the average time to detection. Use a straw as a pipette by placing your thumb over one end to remove liquid for testing with a chemical indicator over the course of detection. Discuss how to share your data with classmates with your instructor. Write your experimental design in your lab report.
Example procedure: Time to detect substances located outside the cellophane bag from 0-10 minutes. Remove liquid from the surrounding water in the bowl at 1-minute intervals to test for glucose by sealing the end of a straw with your thumb. If investigating temperature, replace dilution with two different temperatures. Record your results in the data tables below.
|
|
Independent Variable [Dilution (circle one): 1X 5X 10X 20X] or [Temperature] Trials #1-3 | |||||
|
Time |
Glucose |
Starch |
Glucose |
Starch |
Glucose |
Starch |
|---|---|---|---|---|---|---|
|
0-Start |
|
|
|
|
|
|
|
1 |
|
|
|
|
|
|
|
2 |
|
|
|
|
|
|
|
3 |
|
|
|
|
|
|
|
4 |
|
|
|
|
|
|
|
5 |
|
|
|
|
|
|
|
6 |
|
|
|
|
|
|
|
7 |
|
|
|
|
|
|
|
8 |
|
|
|
|
|
|
|
9 |
|
|
|
|
|
|
|
10 |
|
|
|
|
|
|
|
|
Independent Variable [Dilution] or [Temperature] |
|||||
|
Time |
Glucose |
Starch |
Glucose |
Starch |
Glucose |
Starch |
|---|---|---|---|---|---|---|
|
10-End |
|
|
|
|
|
|
Lab Report
Write a brief account of your experiment, including a statement of your experimental question, your control group, sample size, experimental group replications, and a table of results of which compounds moved. In the introduction/background section of your lab report, explain what happens during simple diffusion and discuss two factors that influence the rate of diffusion. Write 1-2 paragraphs about the experimental results to your question, how the results relate to your hypotheses, and what the results might mean for a cell and its survival. Graph the average time it took for each substance to be detected or provide data specific to your chosen method.
References
Bohrer KE. 2006. Effects of drugs on pulsation rate of Lumbriculus variegatus (blackworms). p. 127–146. In: O’Donnell MA, editor. Tested studies for laboratory teaching. Vol. 27. Proceedings of the 27th Workshop/Conference of the Association for Biology Laboratory Education (ABLE). 383 p.
Brewer C, Streel E. 2020. Is alcohol in hand sanitizers absorbed through the skin or lungs? Implications for disulfiram treatment. Alcohol and Alcoholism. 55(4):354–356.
Dickson L, Gordon W. 2015. Laboratory manual: Biology 101. 2nd ed. Dubuque (IA): Kendall Hunt Publishing.
Jiang R, Roberts MS, Collins DM, Benson HA. 1999. Absorption of sunscreens across human skin: an evaluation of commercial products for children and adults. Br J Clin Pharmacol. 48(4):635–637.
Ryan AB, Elwess NL. 2017. A new approach in examining the influence of drugs on pulsation rates in blackworms (Lumbriculus variegatus). J Exp Biol. 43(2):38.
Schreiver I, Hesse B, Seim C, Castillo-Michel H, Villanova J, Laux P, Dreiack N, Penning R, Tucoulou R, Cotte M, Luch A. 2017. Synchrotron-based ν-XRF mapping and μ-FTIR microscopy enable to look into the fate and effects of tattoo pigments in human skin. Sci Rep. 7(1). doi:10.1038/s41598-017-11721-z.
Science Learning Hub – Pokapū Akoranga Pūtaiao. 2024. Dorsal and ventral blood vessels [Internet]. Hamilton (NZ): The University of Waikato Te Whare Wānanga o Waikato; [cited 2025 May 3]. Available from: https://www.sciencelearn.org.nz/images/2793-dorsal-and-ventral-blood-vessels.
Seeley A, Bellamy C, Davies NA, Wallace MJ. 2021. Lumbriculus variegatus: A novel organism for in vivo pharmacology education. Pharmacol Res Perspect. 9(5):e00853.
