Appendix 1: Instructions on How to Use Google Sheets
Create a Data Table
- Open Google Sheets
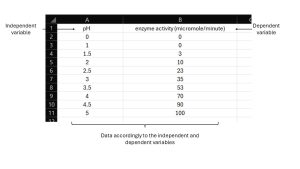
- First row and/or first column are conventionally the titles of your variables
- The first cell in the row is the independent variable
- The second cell in the row is the dependent variable
- Enter data into each cell accordingly to your headers/titles
- See example below:
Create a Graph with Standard Deviation Bars
- Select your data you wish to graph
- Select “Insert” and then “Chart”
- In Chart editor: Setup – Pick a chart type (bar, line, scatter, etc.)
- Add Standard Deviation bars
- In Chart editor: Customize – Expand Series, check Error bars
- Under type drop-down window, select Standard Deviation and type in the value
- Add graph title and axis titles
- In Chart editor: Customize – Expand Chart & axis title
- Under type drop-down window, select your title of interest
- Under title text, type in your titles
Calculations
Allele frequency (Lab 10: Microevolution and Natural selection)
- Select an empty cell
- Type “= (number of individual with trait / total number of individuals in populations) * 100
- The value presented in the cell is the percentage of individuals (allele frequency) in the population.
Mean
- Select an empty cell
- Type “=Average” and drop-down window of functions will appear
- Select AVERAGE and Average(value1, [value2,…] will appear
- Select the range of data you want to calculate, and press enter
- The mean value will appear
Median
- Select an empty cell
- Type “=Median” and drop-down window of functions will appear
- Select MEDIAN and MEDIAN(value1, [value2,…] will appear
- Select the range of data you want to calculate, and press enter
- The median value will appear
Mode
- Select an empty cell
- Type “=Mode” and drop-down window of functions will appear
- Select MODE and MODE(value1, [value2,…] will appear
- Select the range of data you want to calculate, and press enter
- The mode value will appear
Standard Deviation (SD)
- Select an empty cell
- Type “=STDEV” and drop-down window of functions will appear
- Select STDEV and STDEV(value1, [value2,…] will appear
- Select the range of data you want to calculate, and press enter
- The SD value will appear
