Appendix 2: Instructions on How to Use the Venier Probes
Vernier Carbon Dioxide (CO2) Probe for Lab 7: Aerobic Cellular Respiration
!!! DO NOT INSERT THE DEVICE INTO A LIQUID!!!
Materials
- Go Direct CO2 Gas Sensor
- Micro USB Cable
- 250mL Nalgene bottle w/Lid
- Drinking Straw
Instructions How to Download Vernier Data Acquisition Software and Connect Sensor to Electronic Device
- Turn on sensor (the LED will blink red). Allow the sensor to heat up for at least 180 seconds before beginning to collect data.
- If working in a pair, it is recommended that one of the lab partners download the Vernier Data Acquisition Software onto their electronic device.
- Go to www.vernier.com/start-go-direct
- Select the electronic device you will connect the Go Direct Sensor
- Download or launch (depends on electronic device) the graphical analysis application. DO NOT USE the online graphical analysis.
- Instructions to connect the sensor using Bluetooth or USB is below the “Get Graphical Analysis” section
- Find the ID of your sensor above the bar code.
Instructions How to Collect Data on Vernier Data Acquisition Software
- Turn on sensor. The LED will blink red.
- Launch Vernier Graphical Analysis App, then click Sensor Data Collection.
- See step #5 in “Instructions How to Download Vernier Data Acquisition Software and Connect Sensor to Electronic Device” section.
- When graph appears, the x-axis should be labeled time(s) and y-axis should be labeled CO2 Gas (ppm)
- Attach sensor (hole side) into the top of the Nalgene botte and insert the straw in the bottom of the bottle.
- Click “collect” button to collect CO2 measures
- Subject will do activity for 2 minutes minimum.
- Once subject completes activity, they will gently blow into straw for 30 seconds. They can take breaths in between if they cannot how blow 30 seconds straight.
- Click on the magnifying icon (bottom left of the screen) to zoom in or out of data.
- Click “stop” button after 30 seconds of exhaling.
- Immediately save the data: Click on “Untitled” (upper left corner), select “Save As” and label your file accordingly.
- Detach CO2 sensor from bottle and wave both sensor and bottle to recalibrate CO2 measures back towards 0 ppm.
- As subject repeats step 7, reattach CO2 sensor to bottle and do step 6.
- Repeat steps 7 – 12 until you have collected all of your data.
Instructions How to Analyze Data on Vernier Data Acquisition Software
- Open data file.
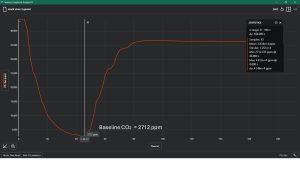
2. Click on “graph” icon (lower left corner) and select “View Statistics”.
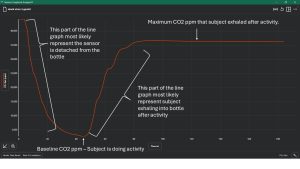
3. Click on the part of the line graph closest to 0ppm to record baseline CO2 (ppm) measures.
4. Click on the part of the line graph that best represent the subject maximally exhaled into the straw and record the CO2 (ppm) measure.
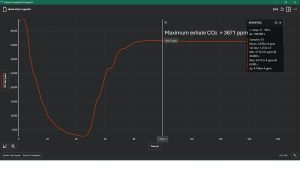
5. Subtract step #4 value from step #3 value to determine total CO2 exhaled by subject after activity.
6. Record that value in data table.
