10 Microevolution and Natural Selection
Download this lab as a Microsoft Word document.
Download the lab response form (Microsoft Word document) to access the questions only.
The purpose of this activity is to investigate the microevolution of drug-resistant bacteria.
Learning Objectives
At the conclusion of this exercise, students will be able to:
- Simulate and observe the microevolution of bacteria.
- Determine the factors that drive changes in allele frequency.
- Calculate the allele frequency in a population.
- Determine an organism’s fitness.
- Identify the mode of natural selection in a population.
- Describe the impact of evolution on human society.
Why It’s Relevant
Evolution is a fundamental theme in biology that helps us understand the incredible biodiversity on Earth. Much like the study of history, it allows us to make sense of the present, learn from the past, and inspire positive changes in the world. For instance, the Irish potato famine taught us a valuable lesson about the importance of genetic diversity in crops to ensure a stable food supply. Similarly, protecting keystone species helps maintain population balance within ecosystems, supporting species interaction as well as the health of all species—including humans. Furthermore, understanding how quickly infectious diseases can evolve has enabled us to develop vaccines and other treatments to protect the health of our communities. By studying evolution, we can better safeguard biodiversity and gain insight into what the future might hold for the evolution of the human species.
Introduction
Evolution is the genetic change in populations across generations and is a central theme at all levels of biological organization. It can be studied on two different scales: microevolution and macroevolution. Microevolution focuses on changes in allele frequencies within a population over time, while macroevolution examines broader patterns of change that occur among species over long evolutionary periods. In other words, microevolution serves as the foundation for macroevolutionary processes, since hereditary traits are passed down from parent to offspring or genetically transferred between microorganisms, and consequently, population changes over generations.
One of the key mechanisms driving evolution at both scales is natural selection. Natural selection occurs when individuals with certain heritable traits have greater reproductive success than those with other variations of the trait.
As a result, natural selection leads to increased fitness —an organism’s ability to survive and reproduce—and the development of adaptations, which are heritable traits that improve survival and reproduction in a given environment. If a trait provides an individual high fitness, the associated alleles are more likely to be passed on to future generations, helping maintain the population’s characteristics. Conversely, if a trait results in low fitness, those alleles may decrease in frequency or disappear entirely, reducing genetic diversity within the gene pool or allele frequency in the population.
A current health concern we are facing is the emergence of highly drug-resistant bacteria, such as Acinetobacter baumannii. According to the World Health Organization (WHO), A. baumannii is classified as a critical priority pathogen and is a significant global health threat that causes hospital outbreaks worldwide (Atunes et al. 2014). The bacteria cause infections in wounds and can spread into the blood, lungs, and urinary tract of humans (Antunes et al. 2014). Other species in the Acinetobacter genus are found in natural environments, but A. baumannii is almost exclusively associated with hospital settings, suggesting it has evolved to survive in highly sterile environments (Antunes et al. 2014). Genetic and epidemiological studies suggest that its evolution is driven by a rapid ability to spread, acquire drug resistance genes, and accumulate adaptive mutations (Antunes et al 2014, Diancourt et al 2010, Scoffone et al 2025).
You and your lab partner (if applicable) will perform a simple simulation of the evolution of A. baumannii and apply your knowledge of microevolution and natural selection to the results.
Curiosity and Inquiry
You and your lab partner (if applicable) are going to model the evolution of drug-resistant bacteria. The hypothetical population will include three different alleles of the immunity trait and will be exposed to antibiotics. With this in mind, the question you are asking is:
“Why and how does a bacterium evolve to become a drug-resistant bacteria, like A. baumannii?”
Formulating a Hypothesis
- Develop a hypothesis based on the question above.
- You will model 10 generations of a bacterial population with three alleles: least drug-resistant, drug-resistant, and most drug-resistant. The population will be exposed to antibiotics in each generation.
Prediction #1: Based on the scenario above, what do you predict the allele frequencies will look like by generation 10? In other words, will genetic diversity increase or decrease in the population?
Testing the Hypothesis: Designing an Experiment
Materials for In-Person Courses
- Bacteria phenotype/genotype population:
- Least resistant (allele: A) individuals: 40 large steel paper clips
- Resistant (allele: B) individuals: 30 small steel paper clips
- Most resistant (allele: C) individuals: 30 coated paper clips
- Application of antibiotic:
- Dice or rolling dice app
Alternative Materials for Online Course
- Bacteria phenotype/genotype population (Note: Objects should be different from one another for you to distinguish the bacterial trait):
- Least resistant (allele: A) individuals: 40 of your chosen objects
- Resistant (allele: B) individuals: 30 of your chosen objects
- Most resistant (allele: C) individuals: 30 of your chosen objects
- Application of antibiotic
- Dice or rolling dice simulation app
- What does the collection of objects represent in the bacteria population?
- What evolutionary mechanism does the antibiotic (dice) represent?
Procedure
- Create two groups that each include:
-
- 13 least resistant bacteria (allele: A) individuals
- 6 resistant bacteria (allele: B) individuals
- 1 most resistant bacteria (allele: C) individual
One group will be exposed to antibiotics and the other group will not be exposed to antibiotics.
- Calculate and record starting population allele frequency for the generation. Allele frequency is the proportion of the alleles occurring in the population. Below is the equation:
# of individual(s) with specific genotype / total # of individuals
Your instructor will inform you if they wish for you to manually or automatically calculate the measures. Refer to Appendix 1 for instructions on using Google Sheets to automatically calculate allele frequency. However, you can use any program that you are comfortable with to calculate allele frequency.
- For group 1: roll the dice.
-
- The number of dots facing up represents the number of bacteria that die within the generation and are removed from the population.
- Survivorship of antibiotic exposure:
- The least resistant bacteria have a 1/6 (16.7%) chance of surviving.
- The resistant bacteria have a 3/6 (50%) chance of surviving.
- The most resistant bacteria have a 5/6 (83.3%) chance of surviving
- The first individuals to remove are the A individuals. If there are no more A bacteria, then remove the B individuals. If there are no more B bacteria, then remove the C individuals.
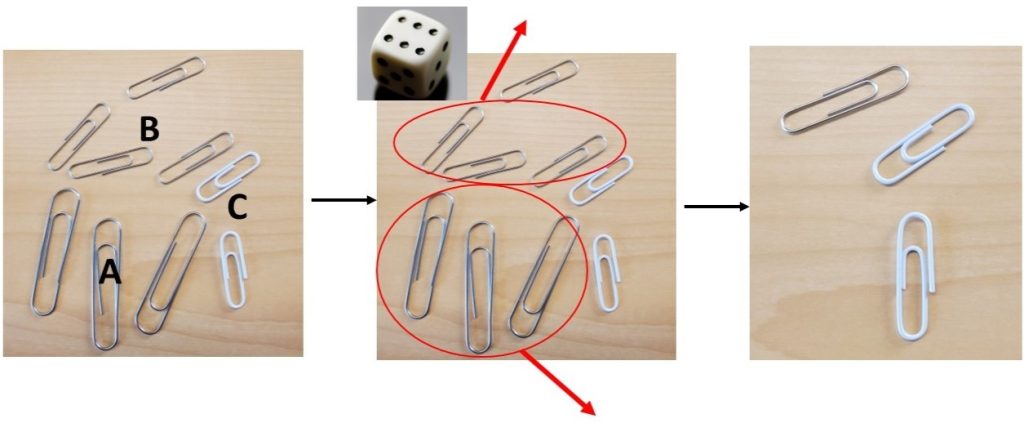
- Example (Figure 10.1):
- Bacteria population: 3 A, 4 B, and 2 C.
- Six dots face up – Remove the 3 A and 3 B individuals to represent death.
- The surviving individuals are 0 A, 1 B, and 2 C.
- For group 2: Do not roll the dice.
For both groups and each generation:
- Record the number of individuals that died and survived in the data collection tables 10.1 or 10.2 below.
- Add two more objects to each bacterial trait.
- Record the total number of objects in the end population column and in the starting population for the next generation in the data collection tables 10.1 or 10.2 below.
- Repeat steps B-G until you have completed 10 generations.
Questions
- What are the independent and dependent variables?
- Which group represents the control group?
- Which group represents the experimental group?
- What are the starting sample sizes of your control and experimental groups?
- How many replications are done in both the control and experimental groups?
- What does procedure step F represent in the bacteria population?
Testing the Hypothesis: Data Collection
- Table 10.1: Control Group Data Table
| Generation | Bacteria Trait and Allele | Start Population Allele Frequency (%) | # of individuals that died | # of individuals that survived | End population Allele Frequency (%) |
|---|---|---|---|---|---|
| 1 |
Least resistant (A) |
||||
|
|
Resistant (B) |
||||
|
|
Most resistant (C) |
||||
| 2 |
Least resistant (A) |
||||
|
|
Resistant (B) |
||||
|
|
Most resistant (C) |
||||
| 3 |
Least resistant (A) |
||||
|
|
Resistant (B) |
||||
|
|
Most resistant (C) |
||||
| 4 |
Least resistant (A) |
||||
|
|
Resistant (B) |
||||
|
|
Most resistant (C) |
||||
| 5 |
Least resistant (A) |
||||
|
|
Resistant (B) |
||||
|
|
Most resistant (C) |
||||
| 6 |
Least resistant (A) |
||||
|
|
Resistant (B) |
||||
|
|
Most resistant (C) |
||||
| 7 |
Least resistant (A) |
||||
|
|
Resistant (B) |
||||
|
|
Most resistant (C) |
||||
| 8 |
Least resistant (A) |
||||
|
|
Resistant (B) |
||||
|
|
Most resistant (C) |
||||
| 9 |
Least resistant (A) |
||||
|
|
Resistant (B) |
||||
|
|
Most resistant (C) |
||||
| 10 |
Least resistant (A) |
||||
|
|
Resistant (B) |
||||
|
|
Most resistant (C) |
- Table 10.2: Experimental Group Data Table
| Generation | Bacteria Trait and Allele | Start Population Allele Frequency (%) | # of individuals that died | # of individuals that survived | End population Allele Frequency (%) |
|---|---|---|---|---|---|
| 1 |
Least resistant (A) |
||||
|
|
Resistant (B) |
||||
|
|
Most resistant (C) |
||||
| 2 |
Least resistant (A) |
||||
|
|
Resistant (B) |
||||
|
|
Most resistant (C) |
||||
| 3 |
Least resistant (A) |
||||
|
|
Resistant (B) |
||||
|
|
Most resistant (C) |
||||
| 4 |
Least resistant (A) |
||||
|
|
Resistant (B) |
||||
|
|
Most resistant (C) |
||||
| 5 |
Least resistant (A) |
||||
|
|
Resistant (B) |
||||
|
|
Most resistant (C) |
||||
| 6 |
Least resistant (A) |
||||
|
|
Resistant (B) |
||||
|
|
Most resistant (C) |
||||
| 7 |
Least resistant (A) |
||||
|
|
Resistant (B) |
||||
|
|
Most resistant (C) |
||||
| 8 |
Least resistant (A) |
||||
|
|
Resistant (B) |
||||
|
|
Most resistant (C) |
||||
| 9 |
Least resistant (A) |
||||
|
|
Resistant (B) |
||||
|
|
Most resistant (C) |
||||
| 10 |
Least resistant (A) |
||||
|
|
Resistant (B) |
||||
|
|
Most resistant (C) |
Interpreting and Visualizing Your Data
- Now plot the data that your group collected. Label the x and y axes and choose the appropriate number scale for each axis. Display the end population allele frequency for each generation between the control and experimental groups. Your instructor will inform you if they wish for you to manually or automatically create the graph. Refer to Appendix 1 for instructions on using Google Sheets to automatically create graphs with standard deviation bars. However, you can use any program that you are comfortable with. Helpful Tip: Apply your knowledge about independent and dependent variables when labeling the axes.

- What is the allele frequency from the starting population in generation 1?
- What is the allele frequency from the end population in generation 10?
- Do you notice patterns in the allele frequency throughout all generations?
Interpreting and Visualizing the Class Data
Class Data Spreadsheet Entry
Once you have collected all your data, enter your data in the class spreadsheet on Google Sheets. Your instructor will provide you with the link.
Complete the simple statistical analysis of the class data in the table below.
- What are the mean and standard deviation of the control group? (Your instructor will inform you if they wish for you to manually or automatically calculate the measures. Refer to Lab 1: Scientific Thinking and Method manually calculate or appendix 1 for instructions on using Google Sheets to automatically calculate measures. However, you can use any program that you are comfortable with.
|
|
Start Population Allele Frequency (%) of Least Resistant generation 1 |
End population Allele Frequency (%) of Least Resistant generation 10 |
Start Population Allele Frequency (%) of Resistant generation 1 |
End population Allele Frequency (%) of Resistant generation 10 |
Start Population Allele Frequency (%) of Most Resistant generation 1 |
End population Allele Frequency (%) of Most Resistant generation 10 |
|---|---|---|---|---|---|---|
|
Mean |
|
|
|
|
|
|
|
Standard Deviation |
|
|
|
|
|
|
- What are the mean and standard deviation of the experimental group?
|
|
Start Population Allele Frequency (%) of Least Resistant generation 1 |
End population Allele Frequency (%) of Least Resistant generation 10 |
Start Population Allele Frequency (%) of Resistant generation 1 |
End population Allele Frequency (%) of Resistant generation 10 |
Start Population Allele Frequency (%) of Most Resistant generation 1 |
End population Allele Frequency (%) of Most Resistant generation 10 |
|---|---|---|---|---|---|---|
|
Mean |
|
|
|
|
|
|
|
Standard Deviation |
|
|
|
|
|
|
Class Data Analysis and Graphing
- Now plot the data that the class collected. Label the x and y axes and choose the appropriate number scale for each axis. Graph the mean and the standard deviation bars for both the control and experimental groups. Your instructor will inform you if they wish for you to manually or automatically create the graph. Refer to Appendix 1 for instructions on using Google Sheets to create graphs with standard deviation bars. However, you can use any program that you are comfortable with.

- Do you notice patterns between the independent and dependent variables? Explain the relationship.
Making a Conclusion
- Do your results validate or reject your group’s hypothesis? Why or why not?
- Do your data display the same relationship as the class data? If not, describe the difference(s).
- When analyzing the data, would you use your data or the class data to formulate your conclusions? Why?
- Does the class data validate or reject your group’s hypothesis? Why or why not?
Using the class data, answer the following questions:
- Which population had the greatest genetic diversity by the 10th generation?
- Which population had the greatest allele C frequency by the 10th generation?
- Which organism had the greatest fitness by generation 10 in the experimental group? How did the organism achieve this?
- What was the selective pressure or agent in the activity and which group was not under selective pressure?
- Which microevolution mechanism favored the increased fitness and adaptiveness of the bacterial trait?
- Which mode of natural selection does the phenotype/genotype best represent in both the control and experimental groups?
- Does a prevalent trait in the experimental group make this organism adapt perfectly to its habitat? Why?
- Do you feel that doctors should be prescribing antibiotics for pathologies other than bacterial infections? Justify your stance with an evidence-based argument based on this activity.
- Based on what you have learned in this activity, how would you educate others about why evolution is important?
- According to Diancourt, et al., their study suggests that one of the A. baumannii clones may spread through the bottleneck effect. What is the bottleneck effect and how would this microevolutionary mechanism cause outbreaks in hospitals?
References
Antunes LCS, Visca P, Towner KJ. 2014. Acinetobacter baumannii: evolution of a global pathogen. Pathog Dis. 71(3):292–301. doi: 10.1111/2049-632X.12125.
Curriculum Research & Development Group. 2016. Activity: modeling evolution [Internet]. Honolulu (HI): University of Hawaiʻi at Mānoa. Available from: https://manoa.hawaii.edu/exploringourfluidearth/biological/what-alive/evolution-natural-selection/activity-modeling-evolution
Diancourt L, Passet V, Nemec A, Dijkshoorn L, Brisse S. 2010. The population structure of Acinetobacter baumannii: expanding multiresistant clones from an ancestral susceptible genetic pool. PLoS One. 5(4):e10034. doi: 10.1371/journal.pone.0010034.
Peleg AY, Seifert H, Paterson DL. 2008. Acinetobacter baumannii: emergence of a successful pathogen. Clin Microbiol Rev. 21(3):538–582. doi: 10.1128/CMR.00058-07.
Professor Revell. 2021. Lab 10 microevolution. YouTube. Available from: https://www.youtube.com/watch?v=TbmM4HA3MUg
Scoffone VC, Trespidi G, Barbieri G, Arshad A, Israyilova A, Buroni S. 2025. The evolution of antimicrobial resistance in Acinetobacter baumannii and new strategies to fight it. Antibiotics. 14(1):85. doi: 10.3390/antibiotics14010085
World Health Organization (WHO). 2024 May 17. WHO updates list of drug-resistant bacteria most threatening to human health [Internet]. Geneva (Switzerland): World Health Organization; [cited 2025 Apr. 1]. Available from: https://www.who.int/news/item/17-05-2024-who-updates-list-of-drug-resistant-bacteria-most-threatening-to-human-health
Zhang S, Di L, Qi Y, Qian X, Wang S. 2024.Treatment of infections caused by carbapenem-resistant Acinetobacter baumannii. Front. Cell. Infect. Microbio. 14:1395260. Doi:10.3389/fcimb.2024.1395260
A genetic change in populations across generations over a period of time.
Changes in a population’s genetic structure
Broader scale evolutionary changes that scientists see over paleontological time.
Reproduction of individuals with favorable genetic traits that survive environmental change because of those traits, leading to evolutionary change
Individual's production of offspring per breeding attempt or lifetime
Organism’s ability to survive and reproduce.
Heritable traits that improve survival and reproduction in a given environment
A gene variation.
All the alleles that the individuals in the population carry
Rate at which a specific allele appears within a population.
The study of genes, genetic variation, and heredity in organisms
A branch of medicine that studies incidence, distribution and possible control of diseases and other factors relating to health
The observable trait expressed in an organism.
The genetic makeup for a particular trait in an organism.
A factor that may cause an effect that can be observed and measured in the dependent variable.
A factor that is an effect that can be observed and measured which may be caused by the independent variable.
Group of data points, observations, or subjects that Is not exposed to the condition that is being studied but otherwise treated identically to the experimental group.
Group of data points, observations, or subjects that Is exposed to the condition that is being studied but otherwise treated identically to the control group.
The number of data points, observations, subjects, or replicates that are collected in each control and experimental group.
The horizontal axis of a graph.
The vertical axis of a graph.
The average of the set of numbers.
The spread of the data is around the mean and indicates the level of variability within the dataset.
