Lab 16: Evaluating Light and Noise Pollution
Humans have populated the world and introduced technology to re-engineer ecosystems, modify habitats, and create machines to move resources. Cities light up the night, enabling human activity around the clock. As humans transformed the natural environment, stars in the sky and silent moments disappeared. In this lab activity, you will assess light and noise pollution in your region and explore their effects on humans and wildlife.
Lab Objectives
In this lab, you will:
- Understand the causes and types of light and noise pollution.
- Measure light and noise pollution using smartphone apps.
- Compare the temporal and spatial patterns of bird migration to environmental factors, including nighttime lights of urban areas.
- Evaluate the impact of light and noise pollution on the environment, human health, and wildlife.
- Propose methods to reduce light and noise pollution.
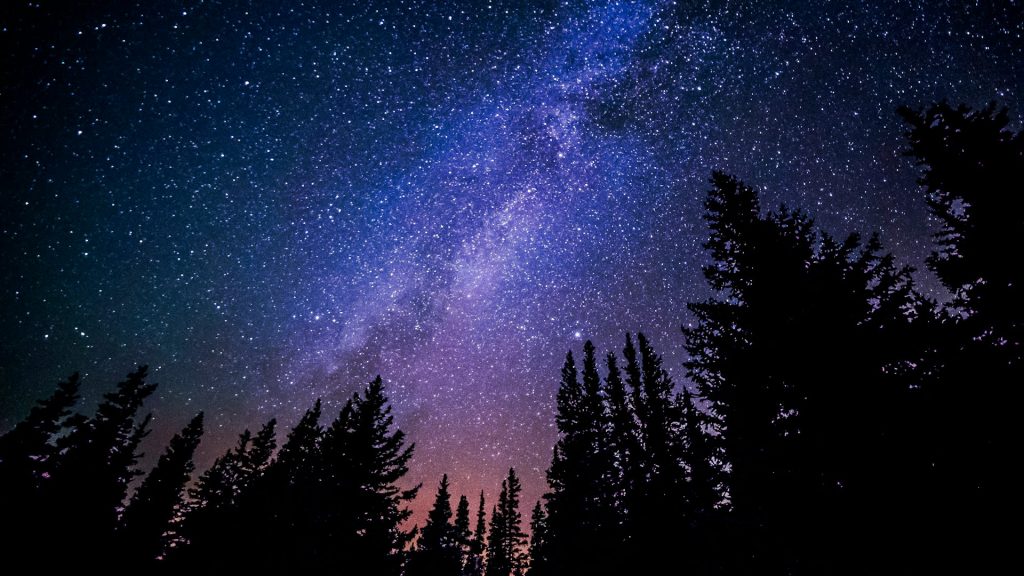
Part 1: Describing and Assessing Light Pollution
In this lab, you will measure light pollution using a smartphone and compare your results to data collected by classmates and other members of the public. Hence, you will be acting as a citizen scientist, contributing to local and global databases on light pollution and our night sky!
- Read about light pollution at Dark Sky International’s What is light pollution? or another source of your choosing. Answer questions 1-2 in Part 1 of the Lab Response Form.
- Explore information on these world maps of light pollution: NASA’S blue marble (based on NASA 2012) and CIRES Artificial Sky Brightness (CIRES 2025; from a partnership between the University of Colorado Boulder and NOAA). Answer question 3 in Part 1 of the Lab Response Form.
- Download Pocket Science’s app measuring light pollution on your iPhone or Android smartphone. You may need to work with a classmate who is able to do this.
- Plan your observation locations and times. You will need at least two sites: one in a highly lit area (e.g., near a streetlight or building) and one in a dark area (e.g., a park or rural area, if possible). Check out the forecast for clear weather at Clear Outside, a site designed by astronomers for viewing the night sky. There are also Clear Outside apps for smartphones, linked to on the home page of their website.
- Discuss with your instructor and, if applicable, classmates to coordinate times (e.g., at night after sunset but before sunrise) and frequency of light measurements (for how many nights and at what intervals).
- Follow instructions in your app to take light level measurements. Take 3 different readings spaced out over a pre-determined time interval (e.g., 15-minute duration). Take readings at a consistent height (e.g., 1 meter above the ground) or as determined by your app.
- In the data table (Table 16.1) on Part 1 of the Lab Response Form, record the date, time, location (e.g., city, state, other details, possibly latitude/longitude coordinates), light level (provide the units given on your app), and the source(s) of light pollution (e.g., streetlights, car headlights, building lights).
- Answer question 4 in Part 1 of the Lab Response Form.
- Compare your measurements to those of your classmates. Also go to the online tool Dark Sky Meter to find other measurements of the night sky for your area. Answer questions 5–8 in Part 1 of the Lab Response Form.
Part 2: Light Pollution and Migrating Birds
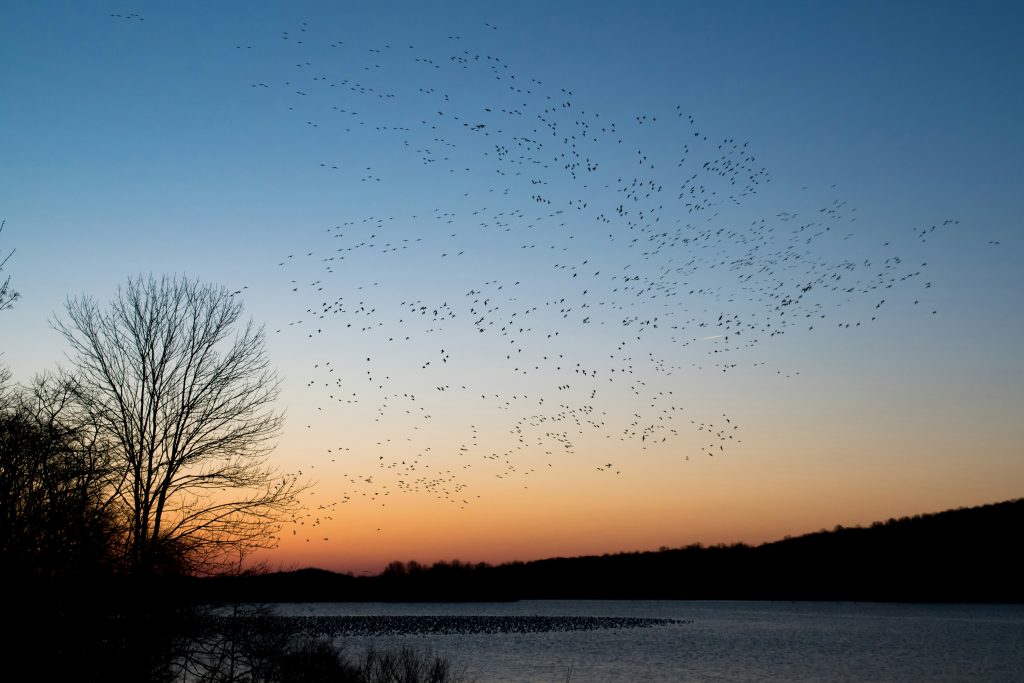
Billions of birds migrate across North America each year (Figure 16.2), traveling from their breeding to overwintering areas in the Fall and back in the opposite direction in the Spring. During these journeys, birds must contend with weather conditions, food availability, predators, exhaustion, and human-created hazards. Public, scientific, and conservation interest in birds led to efforts to track bird migration. In 1999, the BirdCast project began as a collaboration among various government, academic, and conservation organizations (US EPA 2001). The project, currently lead by researchers from Cornell Lab of Ornithology, Colorado State University, and the University of Massachusetts Amherst, makes use of RADAR data to track nocturnal bird migration across the United States.
- Go to Bird Cast Lights Out. Scroll down to watch the video. Answer question 1 in Part 2 of the Lab Response Form.
- Go to Bird Cast Migration Tools, then go to Live Bird Migration Maps. Depending on your time of year, select current activity or use the drop-down menu at the top of the map to choose 3 dates in the past during a fall or spring season. (Recommendation: Discuss times to investigate with your instructor.)
- Click on the map and observe the animation. Notice the progression of sunset to sunrise and of birds moving. Take a screenshot of peak bird movement, then note location and direction of travel, and time. Repeat for your other days. Answer question 2 in Part 2 of the Lab Response Form.
- Open Google Earth. The web version will suffice. Select Start Exploring to observe landcover features for an area coinciding with active bird migration for your dates. Zoom in to or enter your location of interest in the search window on the screen. Choose the layers you wish to view. Keep the Satellite view of the Basemap selected. Make note of the landcover for your area and especially if it is rural or urban. Answer question 3 in Part 2 of the Lab Response Form.
- Investigate the past weather for the dates you selected. A recommended site is the National Oceanic and Atmospheric Administration’s (NOAA’s) Past Weather. On this site, you can select among active weather stations for your dates of interest to retrieve temperature and precipitation data. You may need to select more than one station to obtain your data. It will be depicted as a time series graph, with a sliding vertical line that you can move over to a date of interest. Answer question 4 in Part 2 of the Lab Response Form.
Part 3: Describing and Assessing Noise Pollution
Noise pollution disrupts the natural environment and human well-being. You will measure environmental noise with a smartphone app, identify its sources, then distinguish anthropogenic noise and its potential effects on ecosystems and human health.
- Download one of these noise detection apps: Android: Decibel Meter or Sound Meter in Google Play Store; iPhone: Decibel Ultra via the Apple App Store.
- Calibrate your phone using the sound meter in the lab (or use a speaker with a known sound level).
- Each student or group of students will choose 2 locations to sample: one noisy (like near a busy road) and another comparatively quiet (like the campus natural areas or a park). Determine how many days to sample (e.g., 2 days over a 1-week period).
- At each location, collect noise data using your phone app twice per day at different times of the day. Data collection should last for 30 minutes each sampling period. First, record background noise level (Baseline, Time= 0; when no major temporary sounds, like an ambulance siren, is occurring) close to your source, about 5 meters (m) away. Continue to record noise levels every 10 minutes (Time = 10, 20, 30). During each interval, take measurements approximately 5 m and 20 m from a noise source, if possible.
- Record the time of measurement, location, noise sources (e.g., traffic, voices, machinery), noise levels in decibels (dB), and distance from noise source in Tables 16.2a and 16.2b of Part 3 of the Lab Response Form. Summarize the noise data as directed and answer the questions in Part 3 of the Lab Response Form.
References
BirdCast (2025). Migration Tools and Science to Action. https://birdcast.info/
CIRES Cooperative Institute for Research in Environmental Sciences (2025) The New World Atlas of Artificial Sky Brightness. University of Colorado Boulder. https://cires.colorado.edu/Artificial-light
Dark Sky International (2025) What is Light Pollution. https://darksky.org/resources/what-is-light-pollution/
First Light Optics (2025) Clear Outside. https://clearoutside.com/
NASA (National Aeronautics and Space Administration), Goddard Space Flight Center. (2012). Earth at Night. https://svs.gsfc.nasa.gov/4019
NOAA (National Oceanic and Atmospheric Administration) Nation Centers of Environmental Information. (2025) Past Weather. https://www.ncei.noaa.gov/access/past-weather/
Pocket Science (2025) Measure light at night with Dark Sky Meter. https://pocket.science/products/dark-sky-meter-and-loss-of-the-night
United States Environmental Protection Agency. (2001) Developing and Implementing a Bird Migration Monitoring, Assessment, and Public Outreach Program for Your Community The Birdcast Project. National Service Center for Environmental Publications (NSCEP), 58 pages. https://nepis.epa.gov/Exe/ZyPURL.cgi?Dockey=30004I1W.txt
Lab 16 Response: Evaluating Light and Noise Pollution
Download this Lab Response Form as a Microsoft Word document.
Part 1: Describing and Assessing Light Pollution
- Define light pollution—you may quote from your source. Provide a complete citation for your source.
- What strategies can be implemented to reduce light pollution in urban and rural areas? Provide complete citation(s) for the source(s) you used.
- Describe the appearance on the map of the areas that had significant amounts of artificial light. Where were some of the darkest night skies on Earth?
|
Date |
Time |
Location |
Light Level (units) |
Sky Type1 (description based on Bortle scale) |
Light Pollution Sources |
|---|---|---|---|---|---|
|
|
|
|
|
|
|
|
|
|
|
|
|
|
|
|
|
|
|
|
|
|
|
|
|
|
|
|
|
|
|
|
|
|
|
|
|
|
|
|
|
|
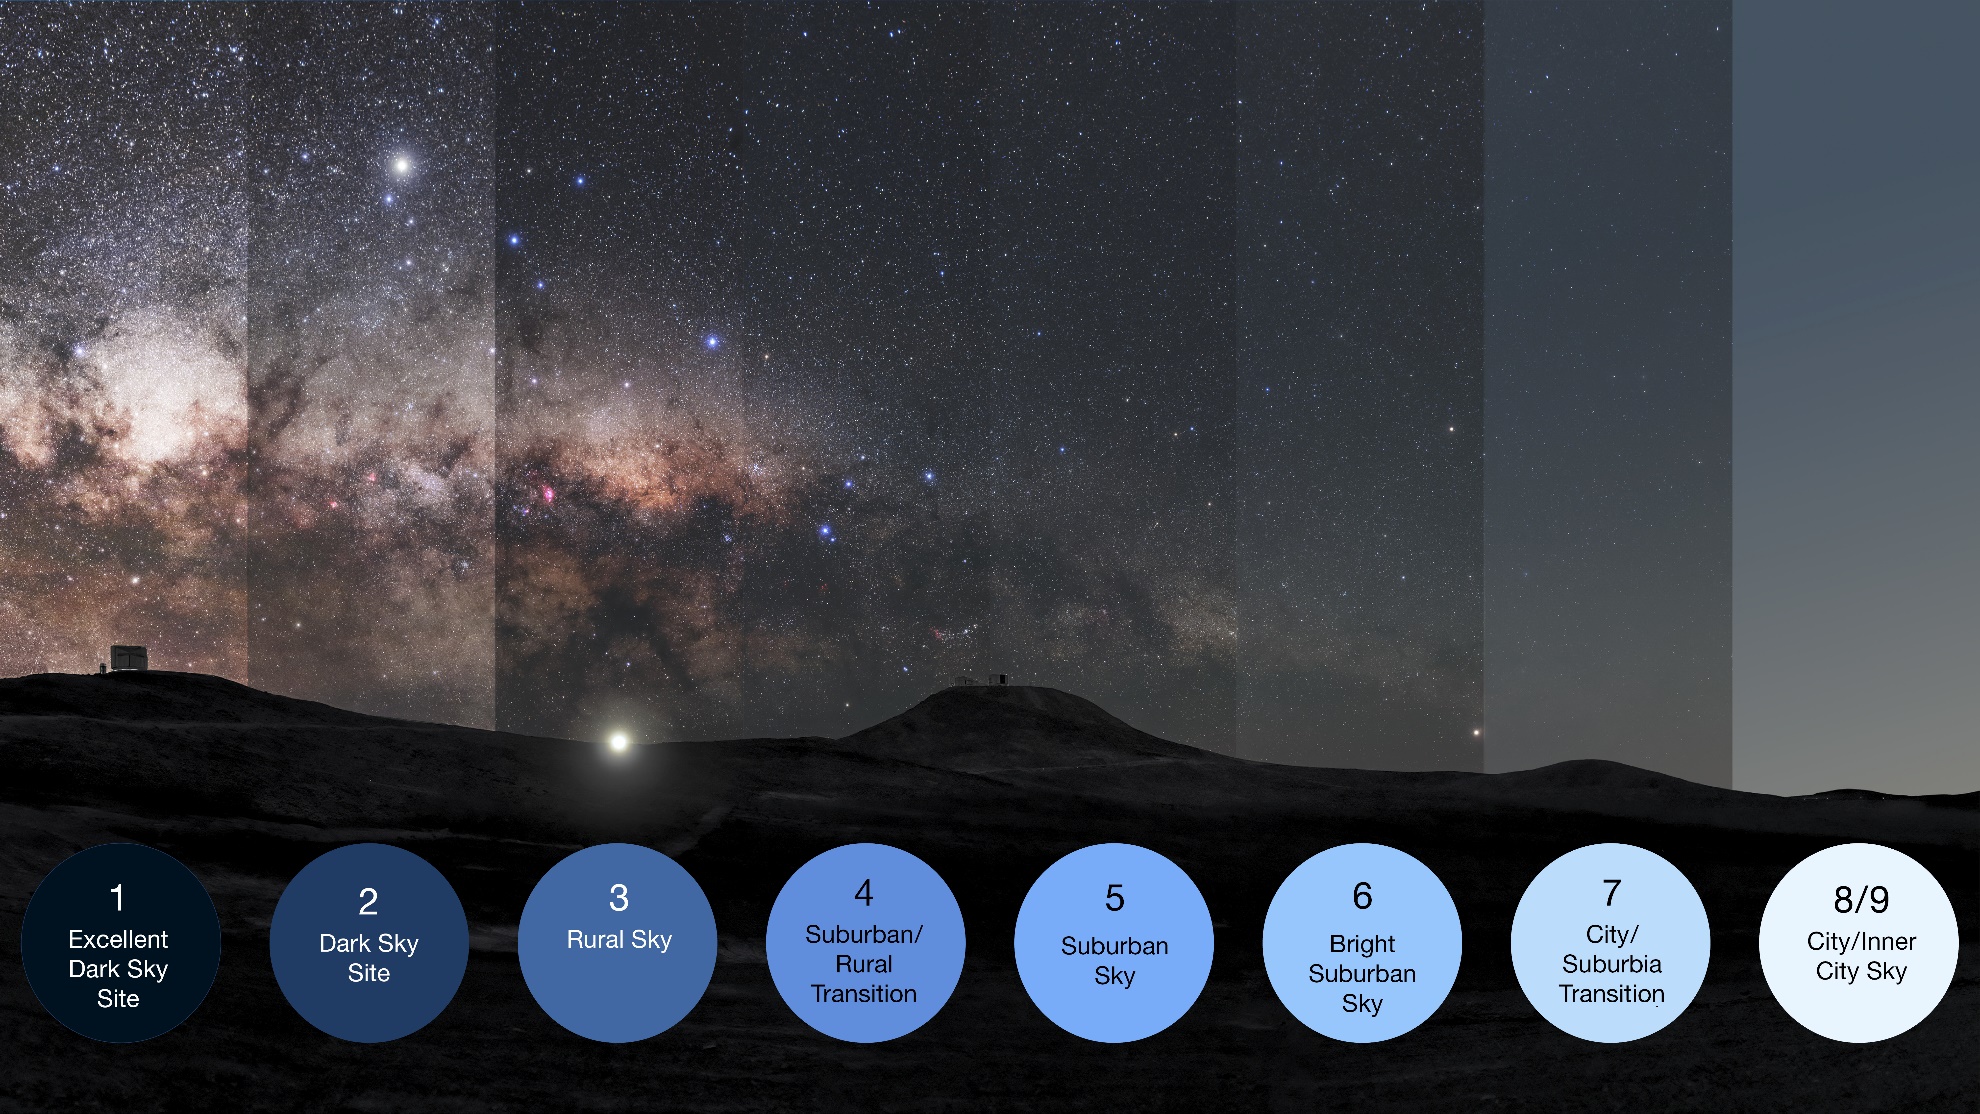
1 refer to Figure 16.3 for descriptions
- Discuss the sources of light pollution you identified.
- How did your results compare to those of your classmates? Explain similarities and differences.
- How did your results compare to the light pollution mapped for your region on Dark Sky Meter? (Use relative comparisons if unit measurements differ between the app’s output and the dark sky meter map.)
- Infer how the amount of light pollution affects the local ecosystem (e.g., plant growth, nocturnal animals, insect activity) and human health. Provide complete citations for the sources you used.
- Describe potential solutions to reduce light pollution in your observation area. Provide complete citation(s) for the source(s) you used.
Part 2: Light Pollution and Birds
- Describe the connection between light pollution and migrating birds: What happens and why? What structures are involved? How significant is the issue? Describe some solutions to reduce the problem.
- Why does the bird tracking data on BirdCast feature nocturnal migration? Cite the source(s) used for your response.
- Provide a screenshot of peak bird movement for one of the days you evaluated. Describe the terrain and landcover (vegetation, water, urban or rural characteristics) of the area you chose. Explain landscape features that might help the birds to navigate and structures that may cause them harm and why. Correlate this to observations on light pollution that you made in Part 1 of this lab.
- Describe the weather in the area during the time you tracked migration. Was the weather a potential factor affecting bird movement? How might the weather interact with other hazards you identified in question 3? Explain.
Part 3: Describing and Assessing Noise Pollution
|
Date, Weather1 |
Time2 |
Distance from Noise Source3 |
Noise Level (dB) |
Noise Pollution Source(s) |
|
|---|---|---|---|---|---|
|
|
Baseline, 0 min. Time: |
|
|
|
|
|
10 min |
|
|
|
||
|
|
|
|
|||
|
20 min |
|
|
|
||
|
|
|
|
|||
|
30 min |
|
|
|
||
|
|
|
|
|||
|
|
Baseline, 0 min Time: |
|
|
|
|
|
20 min |
|
|
|
||
|
|
|
|
|||
|
30 min |
|
|
|
||
|
|
|
|
1 Choose a day with fair weather; note if windy.
2 Begin when background noise is occurring, but no major noise source is active. Record your actual time of day using AM/PM or 24-hour time.
3 Give approximate distance from source (e.g., 5 m, 20 m) and be consistent across all measurements. Baseline measurement will be the closest distance from source taken at start of monitoring (time = 0 min). Your instructor may require you to submit screenshots of your application’s output along with this table.
|
Date, Weather1 |
Time2 |
Distance from Noise Source3 |
Noise Level (dB) |
Noise Pollution Source(s) |
|
|---|---|---|---|---|---|
|
|
Baseline,0 min
Time: |
|
|
|
|
|
10 min |
|
|
|
||
|
|
|
|
|||
|
20 min |
|
|
|
||
|
|
|
|
|||
|
30 min |
|
|
|
||
|
|
|
||||
|
|
Baseline,0 min
Time: |
|
|
|
|
|
10 min
|
|
|
|
||
|
|
|
|
|||
|
20 min |
|
|
|
||
|
|
|
|
|||
|
30 min |
|
|
|
||
|
|
|
|
1 Choose a day with fair weather; note if windy.
2 Begin collecting baseline data when background noise is occurring, but no major noise source is active. Record your actual time of day using AM/PM or 24-hr time.
3 Give approximate distance from source (e.g., 5 m, 20 m) and be consistent across all measurements. Baseline measurement will be the closest distance from source. Your instructor may require you to submit screenshots of your application’s output along with this table.
Part 3 Questions
- (a) Calculate the average noise level at each location. Show your work. (b) Compare the differences in average noise between these relatively noisy and quiet areas.
- Graph the noise level against the time of day for each location to visualize patterns in noise pollution over time. Consult your instructor and group members to efficiently show your data in one or two graphs. Insert your graph(s):
- (a) Which sources contribute most to noise pollution at each site? How did they vary at different times? (b) Compare your results to those of your classmates. Explain similarities and differences.
- What are the potential health impacts of the noise levels you measured for both humans and wildlife? Include consideration of maximum levels. For example, prolonged exposure to sounds over 85 dB can cause hearing damage in humans.
- How does noise pollution affect wildlife behavior, including communication, mating, and feeding patterns?
- What strategies could be implemented to reduce noise pollution at your study sites? In urban areas in general?
