Lab 14: Impacts of Energy Choices and Building a Future Energy Portfolio
Introduction
All the energy we use comes from natural resources like coal, oil, sunlight (such as the solar panels in Figure 14.1), and wind. In some instances, we can directly use these natural resources, called primary energy, as energy sources, like when we use petroleum to drive our cars. In other instances, we convert this primary energy into another form of energy, called secondary energy, such as converting coal or sunlight into electricity. When making energy choices we must consider numerous factors, such as the amount of energy we need, the end-use applications (i.e., transportation, electricity, and heating), and the efficiency of energy conversion. Energy choices are complex, and it is unlikely that any single energy option will fit all our energy needs. Each energy option comes with its own set of tradeoffs that have to be evaluated, not only in terms of the energy source’s appropriateness for a given application, but also so we can identify sustainable energy choices that reduce environmental impact in a manner that is socially, culturally, and economically acceptable.
In this lab, you will be tasked with the responsibility of evaluating various energy options and thinking about how the United States’s total mixture of energy should change by the year 2030.
Notes:
- There are two response forms for this lab. One is designed for group work, and one is designed for individuals. Fill out the response form assigned by your professor.
- This lab is divided into parts that may be completed on different days.
Lab Objectives
In this lab, you will:
- Explain that it takes energy to make energy
- Gather information about the pros and cons of various primary energy sources using credible sources
- Evaluate the social and biological impacts of various primary energy sources
- Develop a set of guiding principles for sustainable energy use
- Build a future energy portfolio for the United States based on your guiding principles for sustainable energy use
Part 1: Analyzing Energy Graphs and Tables
What do we know about energy usage and trajectories from the past through the present?
Begin by reviewing Mason Inman’s “The True Cost of Fossil Fuels,” published in 2013 in Scientific American. (See the references at the end of this lab for the full citation and the research guide for the link to access the article for COD students. Consult with your librarian for an alternate article if this title is not available via your campus library.)
You may also consult Hall’s Synthesis to Special Issue on New Studies on EROI, paying special attention to the main considerations listed at the bottom of the page, for more information on this topic.
Now, analyze charts, tables, and graphs
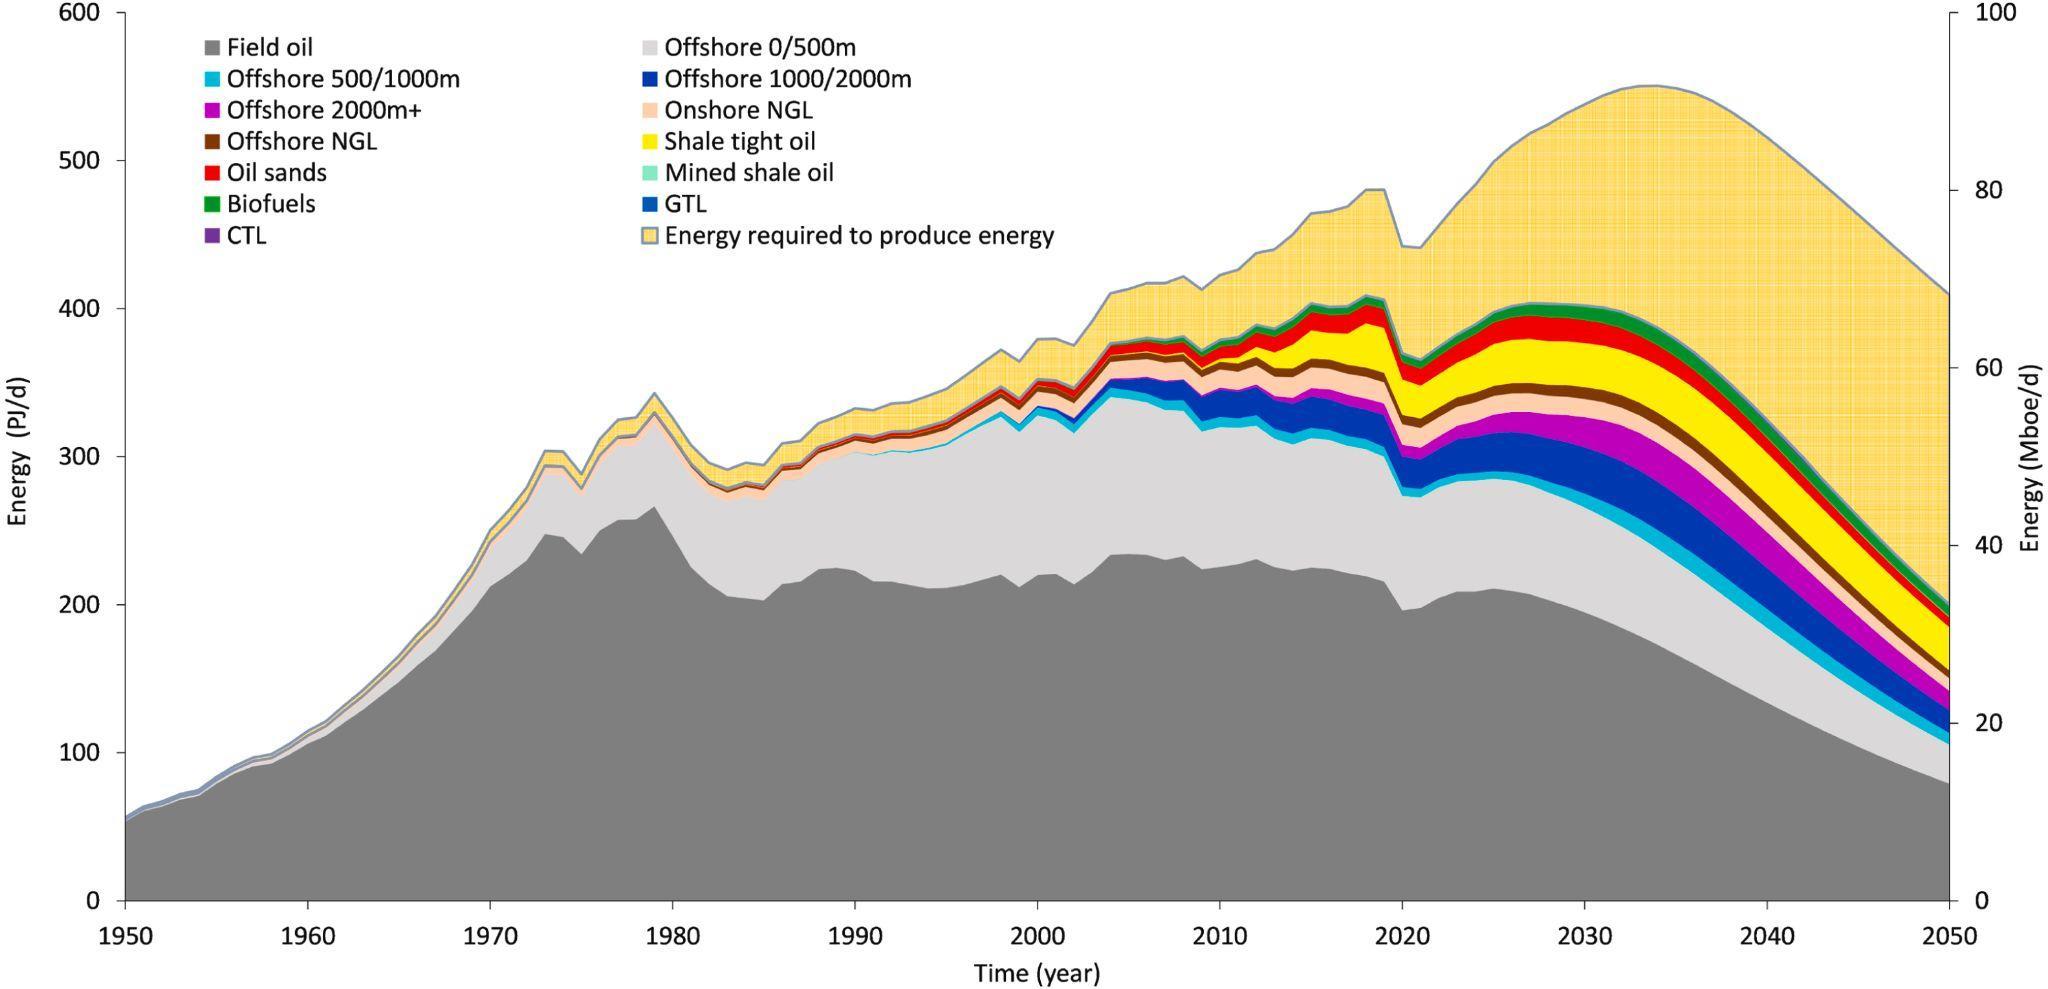
Let’s start by taking a look at the graph below, which documents the net energy production (the amount of energy needed to extract energy, as explained in the Inman article) of oil compared to the energy produced for use. Pay particular attention to the top trend line—what story does the graph below tell?
Average oil liquids net-energy production from 1950 to 2050, compared to the gross energy
Now, let’s turn to renewable fuels. Examine the following table calculated from data collected by the U.S. Department of Energy, which measures energy potential for different categories of renewable energy vs. actual production in the United States in 2020. (You can find the full report linked on the library guide.) What does the data in the table below communicate?
| Type of Resource | Total 2020 Energy Production in the U.S. (TWh/yr) | Total Potential Energy Production (TWH/yr) | Percentage capacity filled |
|---|---|---|---|
| Solar capacity, including Utility Scale PV, CSP, Distributed PV |
= (88 + 3 + 42) 133 TWH/yr |
= (297,486+87,728 + 1432) 386,646 TWH/yr |
= (133 / 386646) * 100
.034% capacity |
| Wind capacity, including land-based, offshore, distributed, ocean | 340 TWH/yr | 48464 TWH/yr | 1% |
| Geothermal capacity, including hydrothermal and enhanced | 17 TWH/yr | 24819 TWH/yr | 0% |
| Biomass | 56 TWH/yr | 505 TWH/yr | 11% |
| Water–Hydropower | 291 TWH/yr | 661 TWH/yr | 44% |
Data from this table is drawn from Table ES-1. Annual Technical Energy Potential for All Renewable Energy Resources in the United States, the Portion of Each Available within 10 mi of Federally Recognized Tribal Lands, and Historical 2020 Energy Production, found in the U.S. Department of Energy’s Renewable Energy Resources Assessment Information for the United States, March 2022. To calculate these values, I’ve divided energy production in the United States column by the 2020 energy production in the chart while ignoring the Potential Energy Production near Tribal Lands column.
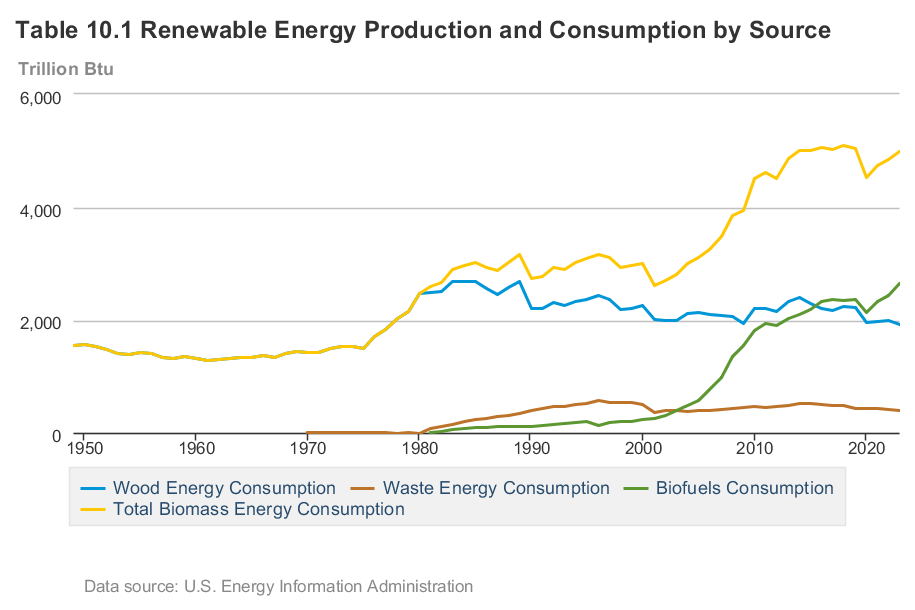
Finally, let’s look at biomass energy production and consumption. What trends do you notice as you look at the graph below?
Lab Directions
Answer the questions in Part 1: Analyzing Graphs and Tables from the Lab Response Form for Groups or Lab Response Form for Individuals, as assigned by your professor.
Part 2: Impacts of Energy Choices
Now that you have a sense of the production or consumption of different types of energy over time from Part 1, we will investigate the benefits and consequences of the use of different energy sources. This includes the convenience, applicability, environmental impact, social impact, economic impact, and health impact from energy capture to use.
Lab Directions
Follow the Lab Directions as described in your assigned Lab Report form for Part 2.
Part 3: Future Energy Portfolio of the United States
Now that you know more about the benefits and consequences of many different types of energy through your work in Part 2 of the Lab Response form, pause to analyze what you’ve learned. How should we prioritize different energy sources?
Lab Directions
Summarize your thoughts by responding to Part 3a of your assigned Lab Response form.
Part 3b: Current and Historical Energy Consumption Data
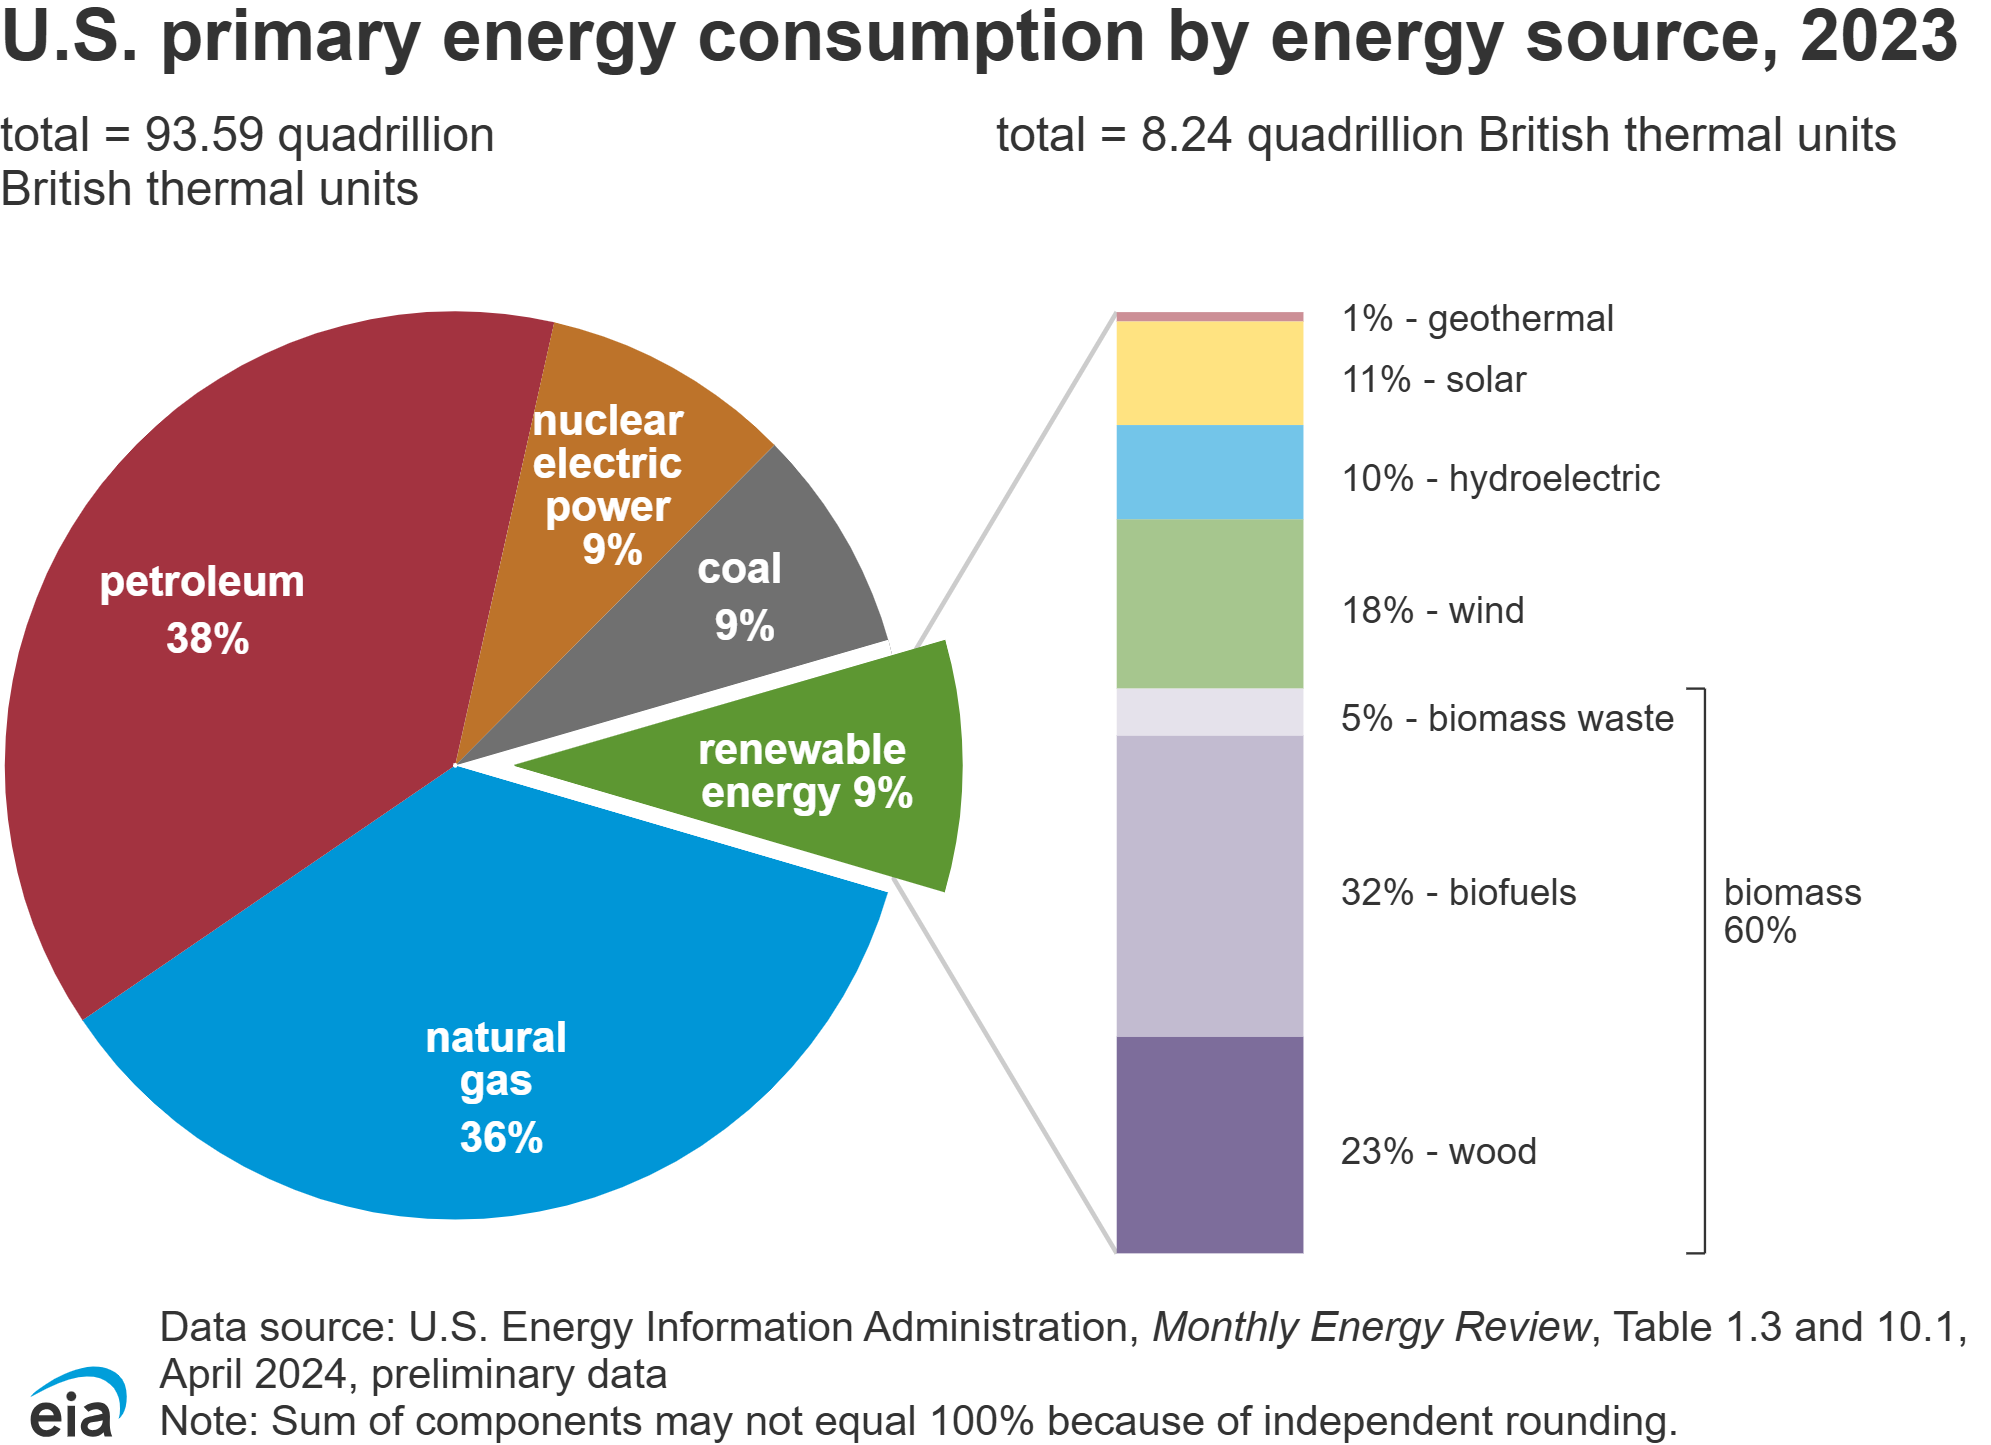
Here is a pie chart of U.S. energy consumption compiled by the U.S. Energy Information Administration for 2023. What do you notice about the current energy mixture in the U.S.?
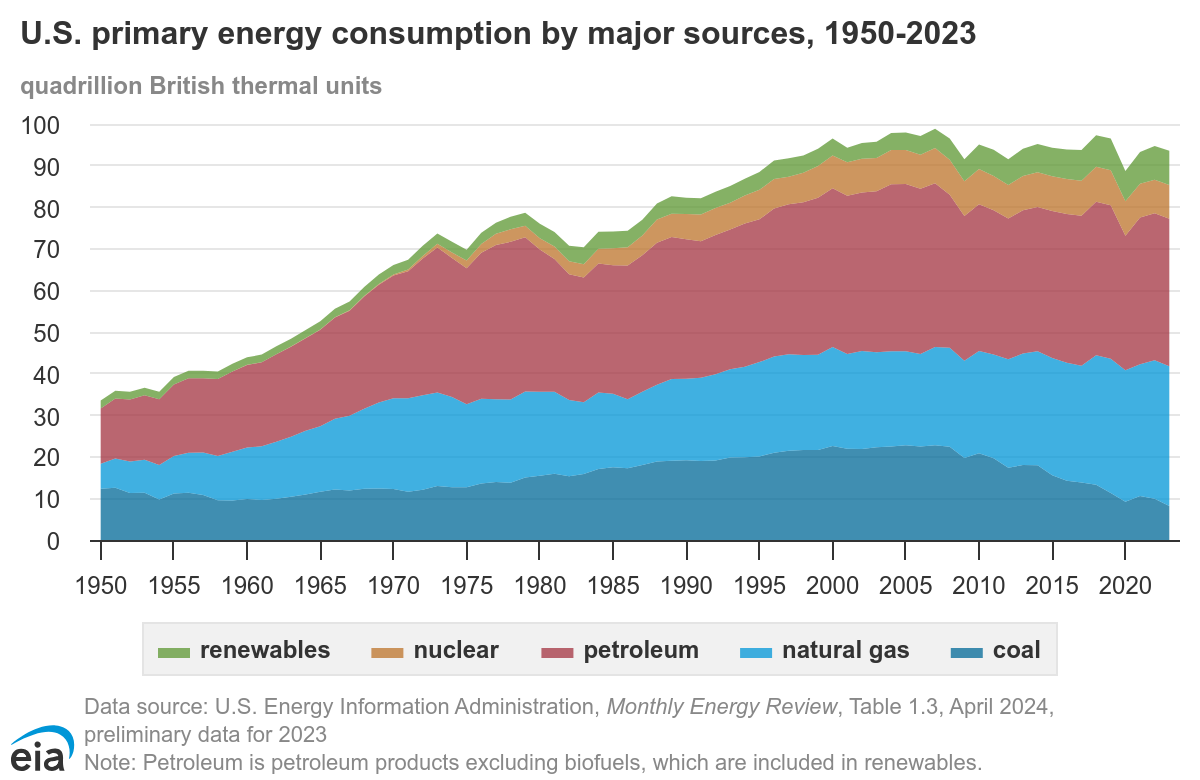
As a group, take a moment to examine the graph below: U.S. primary energy consumption by energy source, 2023 pie chart and U.S. primary energy consumption by major sources, 1950-2023.
This energy consumption mixture has changed over time, according to this graph from the U.S. Energy Information Administration. As you look at the graph below, what trends do you notice in the consumption of different energy sources over time?
Now that you’ve had a chance to look at our current and historical energy mixes, think: what changes should we make, both as individuals and as a country?
Lab Directions
Fill out Part 3b of your assigned Lab Response form. This will include responding to the graphs above, filling out the table, and responding to the summary questions.
References
Delannoy, L., Longaretti, P. Y., Murphy, D., & Prados, E. (2021). Average oil liquids net-energy production from 1950 to 2050, compared to the gross energy. Applied Energy, 304, 117843.
Hall, C. A. S. (2011). Synthesis to Special Issue on New Studies in EROI (Energy Return on Investment). Sustainability, 3(12), 2496-2499. https://doi.org/10.3390/su3122496
Inman, M. (2013). The True Cost Of Fossil Fuels. Scientific American, 308(4), 58–61. (see research guide for the COD article link. Consult with your librarian for an alternate article if this title is not available via your campus library.)
Office of Energy Efficiency & Renewable Energy, U.S. Department of Energy. (2022). Renewable Energy Resource Assessment Information for the United States. Table archived on the Library Research guide.
U.S. Energy Information Administration. (n.d.). Table 10.1 Renewable Energy Production and Consumption by Source. https://www.eia.gov/totalenergy/data/browser [Accessed March 2025].
U.S. Energy Information Administration. (2024, July 15). U.S. Primary Energy Consumption by Source, 2023. U.S. Energy Facts Explained. https://www.eia.gov/energyexplained/us-energy-facts/
U.S. Energy Information Administration. (April 2024). Table 1.3 U.S. Primary Energy Consumption by Major Sources, 1950-2023 Monthly Energy Review. https://www.eia.gov/energyexplained/us-energy-facts/
Lab 14 Response: Impact of Energy Choices (For Individuals)
Download the Lab Response Form for Individuals as a Microsoft Word document.
Download the Lab Response Form for Groups as a Microsoft Word document.
Part 1: Analyzing Energy Graphs and Tables
- Take a look at the graph titled Average oil liquids net-energy production from 1950 to 2050, compared to the gross energy in Part 1 of the lab instructions. What are your key takeaways from this graph? What evidence do you have to support that reading?
- Now, consult the table Calculated Potential of Renewable Energy Resources, 2020 in Part 1 of the lab instructions. What are your key takeaways from this table? What evidence do you have to support that interpretation?
- Consult Renewable Energy Production and Consumption by Source in Part 1 of the lab instructions. What are your key takeaways from this graph? What evidence do you have to support that reading?
Part 2: Impacts of Energy Choices
Directions: Fill out the tables below. You may summarize your textbook to discuss the different fuel choices or consult the Library Research Guide for other credible sources. If you choose to find your own sources, you can use the Library Research Guide or search on your own, but be sure that all sources you use are credible and authoritative (refer to Lab 1 for more information about evaluating sources).
Part 2a: Carbon-based fossil fuels
- For each energy type, summarize the convenience, applicability, environmental impact, social impact, economic impact, and health impact from energy capture to use. Then list what each type of energy is primarily used for, such as transportation, heating, etc. If you use a source other than your textbook, cite it using the website title and URL below the information you’re using.
|
Energy option |
Pros |
Cons |
Uses of energy source |
|---|---|---|---|
|
Coal Definition:
|
|
|
|
|
Petroleum Definition:
|
|
|
|
|
Natural Gas Definition:
|
|
|
|
Part 2b: Non-carbon energy choices
- For each energy type, summarize the convenience, applicability, environmental impact, social impact, economic impact, and health impact from energy capture to use. Then list what each type of energy is primarily used for, such as transportation, heating, etc. If you use a source other than your textbook, cite it using the website title and URL below the information you’re using.
|
Energy option |
Pros |
Cons |
Uses of energy source |
|---|---|---|---|
|
Nuclear (fission) Definition:
|
|
|
|
|
Geothermal Definition:
|
|
|
|
|
Hydropower Definition:
|
|
|
|
|
Wind Definition:
|
|
|
|
|
Solar Definition:
|
|
|
|
Part 2c: Carbon-neutral energy sources
- For each energy type, summarize the convenience, applicability, environmental impact, social impact, economic impact, and health impact from energy capture to use. Then list what each type of energy is primarily used for, such as transportation, heating, etc. If you use a source other than your textbook, cite it using the website title and URL below the information you’re using.
Energy option
Pros
Cons
Uses of energy source
Biomass
Definition:
Biofuel
Definition:
Biogas
Definition:
Part 3: Future Energy Portfolio of the United States
Part 3a: Summarize and explain
- Summarize your own and your classmates’ research from Part 2 to fill out the following table. Provide 3 key takeaways for each energy group, explain if we should limit usage of the energy group or reserve it for specific usages, and then explain your reasoning.
| Energy Group | 3 Key Takeaways | Limit Usage or Prioritize | Why? |
|---|---|---|---|
| Carbon-based fossil fuels | |||
| Non-carbon energy choices | |||
| Carbon-neutral energy usages |
- Are there any outliers (energy sources that are very different from the rest of the group) among the carbon-based fossil fuel energy sources that you would recommend a different prioritization for? If so, which ones and why?
- Are there any outliers among the non-carbon energy sources that you would recommend a different prioritization for? If so, which ones and why?
- Are there any outliers among the carbon-neutral energy sources that you would recommend a different prioritization for? If so, which ones and why?
Part 3b: Current and historical energy consumption data
- What are your key takeaways from the chart U.S. primary energy consumption by energy source, 2023? What evidence do you have to support that reading?
- What are your key takeaways from the graph U.S. primary energy consumption by major sources, 1950-2023? What evidence do you have to support that reading?
- Now compare your responses to the questions from part 3a to the chart U.S. primary energy consumption by energy source, 2023. How do you think this energy mixture should continue to change in the future? List three concrete changes we should make. These proposed changes will serve as your guiding principles for sustainable energy use.
- Based on your guiding principles for sustainable energy use, enter percentages in the table below to represent your recommended energy consumption by energy source in the United States. Numbers from the 2023 data column are calculated from the chart “U.S. primary energy consumption by energy source, 2023.”
|
Energy Source |
2023 Data |
2050 (your ideal mixture) |
Difference between 2023 and 2050 (Express as + or -) |
|---|---|---|---|
|
Petroleum |
38% |
|
|
|
Natural Gas |
36% |
|
|
|
Coal |
9% |
|
|
|
Nuclear |
9% |
|
|
|
Geothermal |
.09% |
|
|
|
Solar |
.99% |
|
|
|
Hydroelectric |
.9% |
|
|
|
Wind |
1.62% |
|
|
|
Biomass |
5.4% |
|
|
- Discuss how your guiding principles for sustainable energy use were influenced by the 2023 data. What tradeoffs did you accept? (i.e., Did a certain choice prioritize the environment, the economy, our standard of living…)
- How will your energy mixture serve societal needs for transportation, heating, and electricity?
- What challenges would you expect to encounter if you attempted to implement your ideal energy portfolio?
- What actions should we take (as individuals and as a society) to move our energy portfolio closer to the mixture that you propose?
Lab 14 Response: Impact of Energy Choices (For Groups)
Download the Lab Response Form for Individuals as a Microsoft Word document.
Download the Lab Response Form for Groups as a Microsoft Word document.
This is a group lab. You are to work collaboratively in your group (and with the class as a whole) to complete it. Each group will submit one lab report. Make sure the names of all group members are recorded on this lab report form.
Part 1: Analyzing Energy Graphs and Tables
- Take a look at the graph titled Average oil liquids net-energy production from 1950 to 2050, compared to the gross energy in Part 1 of the lab instructions. What are your key takeaways from this graph? What evidence do you have to support that reading?
- Now, consult the table Calculated Potential of Renewable Energy Resources, 2020 in Part 1 of the lab instructions. What are your key takeaways from this table? What evidence do you have to support that interpretation?
- Consult Renewable Energy Production and Consumption by Source in Part 1 of the lab instructions. What are your key takeaways from this graph? What evidence do you have to support that reading?
Part 2: Impacts of Energy Choices
Your professor will assign you either an energy source or an energy group (Part 2a: Carbon-based fossil fuels, Part 2b: Non-carbon energy sources, or Part 2c: Carbon-neutral energy sources) to research.
As a group, complete whatever portions of the tables in 2a, 2b, or 2c you are assigned. Follow the directions above each table. You can use the Library Research Guide to find good sources, or search on your own, but be sure that all sources you use are credible and authoritative. (Refer to Lab 1 for more information about evaluating sources).
Once you have completed your assigned research work, finish part 2d and be prepared to present your work from Part 2 to the class.
Part 2a: Carbon-based fossil fuels
- For each energy type you are assigned, research the convenience, applicability, environmental impact, social impact, economic impact, and health impact from energy capture to use. In the source column, provide the author, title, and URL (if applicable) for the sources used for each type of fuel. Remember that at least 3 sources must be included per energy choice.
|
Energy option |
Pros |
Cons |
Source of Information |
|---|---|---|---|
|
Coal Definition:
Uses:
|
|
|
|
|
Petroleum Definition:
Uses:
|
|
|
|
|
Natural Gas Definition: Uses: |
|
|
|
Part 2B: Non-Carbon Energy Choices:
- For each energy type you are assigned, research the convenience, applicability, environmental impact, social impact, economic impact, and health impact from energy capture to use. In the source column, provide the author, title, and URL (if applicable) for the sources used for each type of fuel. Remember that at least 3 sources must be included per energy choice.
|
Energy option |
Pros |
Cons |
Source of Information |
|---|---|---|---|
|
Nuclear (fission) Definition:
Uses:
|
|
|
|
|
Geothermal Definition:
Uses:
|
|
|
|
|
Hydropower Definition:
Uses:
|
|
|
|
|
Wind Definition:
Uses:
|
|
|
|
|
Solar Definition:
Uses:
|
|
|
|
Part 2c: Carbon-Neutral Energy Sources
- For each energy type you are assigned, research the convenience, applicability, environmental impact, social impact, economic impact, and health impact from energy capture to use. In the source column, provide the author, title, and URL (if applicable) for the sources used for each type of fuel. Remember that at least 3 sources must be included per energy choice.
|
Energy option |
Pros |
Cons |
Source of Information |
|---|---|---|---|
|
Biomass Definition: Uses:
|
|
|
|
|
Biofuel Definition:
Uses:
|
|
|
|
|
Biogas Definition:
Uses:
|
|
|
|
Part 2d: Summarize and present your research
- Find one additional map, chart, table, or graph related to the consumption, production, or environmental impact of the fuel or group of fuels you were assigned. Take a screenshot of that item and paste it here. (Not sure where to do this? Look at the Library Research guide for this lab.)
- Cite it: who produced your map, chart, table, or graph? List the author (or corporate author), title of the object, date it was produced, and the URL where you found it.
- Explain the key takeaways from your map, chart, table, or graph. Provide evidence: why did you draw the conclusions you did?
- Pick the most expert of all of the sources you listed above and write it here. Now explain: why did you choose this source? What makes it credible? Use details such as date, authority, and other signs of expertise to make your argument.
Once you have finished Part 2, you will be asked to present your table entries and responses to questions in Part 2d to the class. Your professor will direct you to share your work with the class as a Google document, a discussion board post, or an alternate method.
Part 3: Future Energy Portfolio of the United States
Part 3a: Summarize and explain
- Summarize your own and your classmates’ research from Part 2 to fill out the following table. Provide 3 key takeaways for each energy group, explain if we should limit usage of the energy group or reserve it for specific usages, and then explain your reasoning.
| Energy Group | 3 Key Takeaways | Limit Usage or Prioritize | Why? |
|---|---|---|---|
| Carbon-based fossil fuels | |||
| Non-carbon energy choices | |||
| Carbon-neutral energy usages |
- Are there any outliers (energy sources that are very different from the rest of the group) among the carbon-based fossil fuel energy sources that you would recommend a different prioritization for? If so, which ones and why?
- Are there any outliers among the non-carbon energy sources that you would recommend a different prioritization for? If so, which ones and why?
- Are there any outliers among the carbon-neutral energy sources that you would recommend a different prioritization for? If so, which ones and why?
Part 3b: Current and Historical Energy Consumption Data
- What are your key takeaways from the chart U.S. primary energy consumption by energy source, 2023? What evidence do you have to support that reading?
- What are your key takeaways from the graph U.S. primary energy consumption by major sources, 1950-2023? What evidence do you have to support that reading?
- Now compare your responses to the questions from part 3a to the chart U.S. primary energy consumption by energy source, 2023. How do you think this energy mixture should continue to change in the future? List three concrete changes we should make, using your research and your classmates’ research to support your argument. These proposed changes will serve as your group’s guiding principles for sustainable energy use.
-
Based on your guiding principles for sustainable energy use, enter percentages in the table below to represent your recommended energy consumption by energy source in the United States. Numbers from the 2023 data column are calculated from the chart “U.S. primary energy consumption by energy source, 2023.”
|
Energy Source |
2023 Data |
2050 (your ideal mixture) |
Difference between 2023 and 2050 (Express as + or -) |
|---|---|---|---|
|
Petroleum |
38% |
|
|
|
Natural Gas |
36% |
|
|
|
Coal |
9% |
|
|
|
Nuclear |
9% |
|
|
|
Geothermal |
.09% |
|
|
|
Solar |
.99% |
|
|
|
Hydroelectric |
.9% |
|
|
|
Wind |
1.62% |
|
|
|
Biomass |
5.4% |
|
|
- Discuss how your guiding principles for sustainable energy use were influenced by the 2023 data. What tradeoffs did you accept? (i.e., Did a certain choice prioritize the environment, the economy, our standard of living…)
- How will your energy mixture serve societal needs for transportation, heating, and electricity?
- What challenges would you expect to encounter if you attempted to implement your ideal energy portfolio?
- What actions should we take (as individuals and as a society) to move our energy portfolio closer to the mixture that you propose?
Each group will present and discuss their guiding principles for sustainable energy use and their future energy portfolio. After you have seen your classmates’ work, we will reflect on and discuss the similarities and differences in the guiding principles for sustainable energy use and the future energy portfolio proposed as a class.
