Lab 10: Exploring Your Foodshed
Introduction
Although as a consumer society, most of us are not directly involved in food production, no subject touches us more directly—for without calories, life ends. But producing food is a complicated business. For one thing, the world’s farmers are caught in a dilemma—how to preserve the land’s productive potential and avoid damaging human health and the environment, yet produce food at the volume that is needed to feed the world’s growing population, at a price that consumers are willing to pay, while dealing with agricultural policies that may support farming practices that are contradictory to sustainability principles. Secondly, the growing population makes other demands on the land as well—for housing, roads, shopping malls, etc. And all of this comes at the expense of biodiversity (as croplands expand into natural ecosystems), which ironically should be preserved as a storehouse of genetic material to enhance the properties of crops.
Several sources, such as Our World in Data and The Nutrition Source (a publication of the Harvard T.H. Chan School of Public Health), indicate that current agricultural practices are the leading sources of global environmental change. This is because food production:
- Contributes over 26% of global greenhouse gas emissions
- Occupies 50% of global habitable land (i.e., land that is desert- and ice-free)
- Uses 70% of global freshwater
- Is responsible for 78% of global eutrophication in lakes and coastal areas
- Is the primary factor threatening species with extinction when you consider that
- 94% of non-human mammal biomass is livestock, which means that livestock outweighs wild mammals by a factor of 15-to-1
- 71% of bird biomass is poultry livestock, which means poultry livestock outweigh wild birds by a factor of more than 3-to-1
- The majority of the world’s fish stocks are either fully fished (60%) or overfished (33%)
But it is not only a question of food production. As consumers, our food choices influence how and what food is grown. The marketplace influences what and how we eat, and in turn, where and how we shop and whether we care to read labels persuades the marketplace to offer certain types of foods. And both the marketplace and our food preferences inform farmers about what they should grow and how they should grow our food.
This raises many important questions for us to consider as food consumers: How high on the food chain should we eat? How do food choices affect biodiversity? What is the energy and materials cost of food production? What is the connection between diet, the modes of food production, and human health? What role does the marketplace play in the way that we eat? What is the purpose of labeling? How do food labels convey information about food items to help consumers make sustainable food choices? How might labels be redesigned to better serve consumers? How can we make and support food choices that are best for the environment and human well-being?
In this lab, you will investigate the ecological connections in your food consumption. Using your food choices as a starting point, you will analyze and evaluate various aspects of food production and consider how they apply to your personal life. You will also explore a grocery store you shop at to analyze and evaluate various elements of the marketplace and consider how they might shape the way that you eat. In addition, you will evaluate food labels for the information they include, and what they omit that should be included.
Lab Objectives
In this lab, you will:
- Explore connections between your diet and energy flow in agriculture and food production.
- Evaluate consequences of your food choices for biodiversity.
- Identify patterns that link your food choices to food production systems (i.e., how food is grown).
- Calculate the environmental costs of your food choices.
- Analyze the processing, packaging, and transportation involved in your food choices.
- Explore connections between what the marketplace offers and your food choices.
- Identify links that connect marketplace choices to food production systems.
- Analyze food labels for the information they offer consumers about the food they consume.
- Reflect on ways that food production could be made more sustainable through consumer choices.
Lab Directions
- Tracking your food consumption: To analyze your food habits and their connection to environmental sustainability, the first step is for you to inventory what you eat. In the two datasheets provided, keep track of everything you consume (eat, drink—except water, or otherwise ingest) over a 4-day period. Try not to miss anything. Record your findings as follows:
Datasheet 1: Daily Food Intake: On this datasheet, identify and categorize the components of your food as plant- or animal-based, and record the approximate calories for each food item. For processed foods while you should report the total calories consumed, you only need to list the top 5-7 ingredients which contribute the bulk of the calories. An example of how to do this is shown below. Also for reference, 1 kilocalorie (kcal) = 1 Calorie.
| Day | Food consumed | Total kcal | Plant sources | Plant kcal | Animal sources | Animal kcal |
|---|---|---|---|---|---|---|
| 1 | Granola with milk | 250 kcal | oats, rice, canola, raisins, almonds | 160 kcal | bee (honey) cow (milk) |
90 kcal |
| Two poached eggs | 140 kcal | 0 kcal | chicken (egg) | 140 kcal | ||
| Banana | 100 kcal | banana | 100 kcal | 0 kcal | ||
| Tea – milk, sugar | 150 kcal | tea, sugarcane | 100 kcal | cow (milk) | 50 kcal |
Datasheet 2: Production, Processing, Packaging and Transportation: On this datasheet, record the information itemized below for each food item you consume. If you consumed the same food item (e.g., eggs from the same carton or cereal from the same box) on more than one occasion, just record it once.
-
-
- Food cultivation: Identify how your food was grown: Use categories such as organic versus conventionally grown. As a general rule, if food is not labelled organic, you should assume it is conventionally grown. You can also include descriptions such as feedlot versus grassfeed beef, free range versus caged chicken/eggs, etc.
- Geographic origins: Identify where your food was grown and/or processed: Use categories such as homegrown/processed, locally grown/processed within 100 miles, non-local U.S. origins, imported (identify country).
- Food processing: Describe the type of processing for your food: Use categories such as minimally processed (like fruits or a salad you ate), home cooked, ready to eat (like granola and yogurt), frozen, canned, fully prepared (like in a restaurant).
- Food packaging: Describe the types of packaging for your food: Use categories such as paper, glass, plastic, metal.
-
An example of how to do this is shown below.
| Food consumed | Food cultivation1 | Geographic origins2 | Food processing3 | Food packaging4 |
|---|---|---|---|---|
| Granola | conventional | non-local U.S. | ready to eat | plastic liner and cardboard box |
| Milk | organic | non-local U.S. | ready to drink | cardboard carton and plastic top |
| Eggs | organic | non-local U.S. | home cooked | recycled cardboard carton |
| Banana | conventional | Costa Rica | minimally processed | no packaging |
| Tea | organic | India | ready to brew | paper (teabag, tag, and envelope), cardboard box, plastic wrap |
| Sugar | conventional | non-local U.S./Mexico | ready to eat | paper liner and cardboard box |
Note: Do your best to find out what you can about your food consumption. Reading labels is one way to get information about what is in your food, where it came from, and how it was grown. Similarly, you can get information from company websites, or by ask questions where you shop and eat. Even so, in some cases you might have to make educated estimations, while in other situations information may not be easily knowable (in either case, indicate this in your audit). What you cannot find out about the food you consume also gives you valuable information about your diet choices. As part of tracking your food, you will be asked to describe your research process and share your insights.
- Calculating the impacts of your food consumption: The next step in assessing the connection between your food habits and environmental sustainability is for you to calculate the impacts of what you eat on the environment. Calculate and report your findings in the Lab Response as follows:
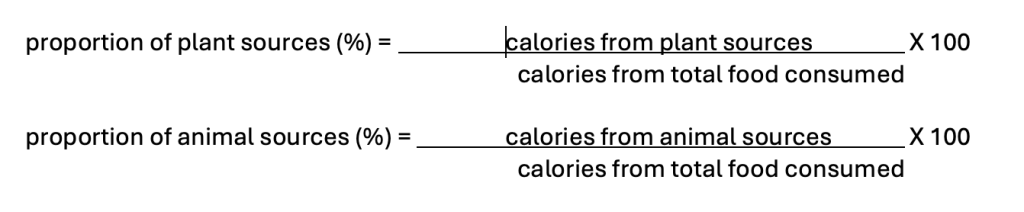
Explore the Trophic Level Efficiency of Your Diet: Based on your 4-day food audit (from Datasheet 1), calculate the proportion of your diet that is derived from plant sources and the proportion that is derived from animal sources. Report both proportions as percentages. To calculate the proportions, follow the formula provided below and show your work:
Explore the Biodiversity of Your Diet: Calculate the biodiversity represented in your 4-day food audit (from Datasheet 1) as follows:
-
- Count and report the total number of plant sources in your diet based on the 4-day food audit (from Datasheet 1).
- Calculate the percentage of plant sources in your diet that come from the 150 plants which are actively cultivated as human food crops (Füleky, 2009). You can follow the formula provided below and show your work:
- proportion of cultivated plants in your diet (%) = (total number of plant species in your diet/150) x 100
- Calculate the percentage of the calories in your 4-day food audit (from Datasheet 1) that came from wheat, corn, rice, and potato. Show your work. To calculate the proportions, you can follow the formulas provided below:
- proportion of calories from wheat (%) = (calories from wheat/calories of total food consumed) x 100
- proportion of calories from corn (%) = (calories from corn/calories of total food consumed) x 100
- proportion of calories from rice (%) = (calories from rice/calories of total food consumed) x 100
- proportion of calories from potato (%) = (calories from potato/calories of total food consumed) x 100
Explore the Carbon, Nitrogen, and Water Footprint of Your Diet: Calculate the carbon, nitrogen, and water footprint of your diet using this Foodprint Calculator developed by the Harvard T.H. Chan School of Public Health.
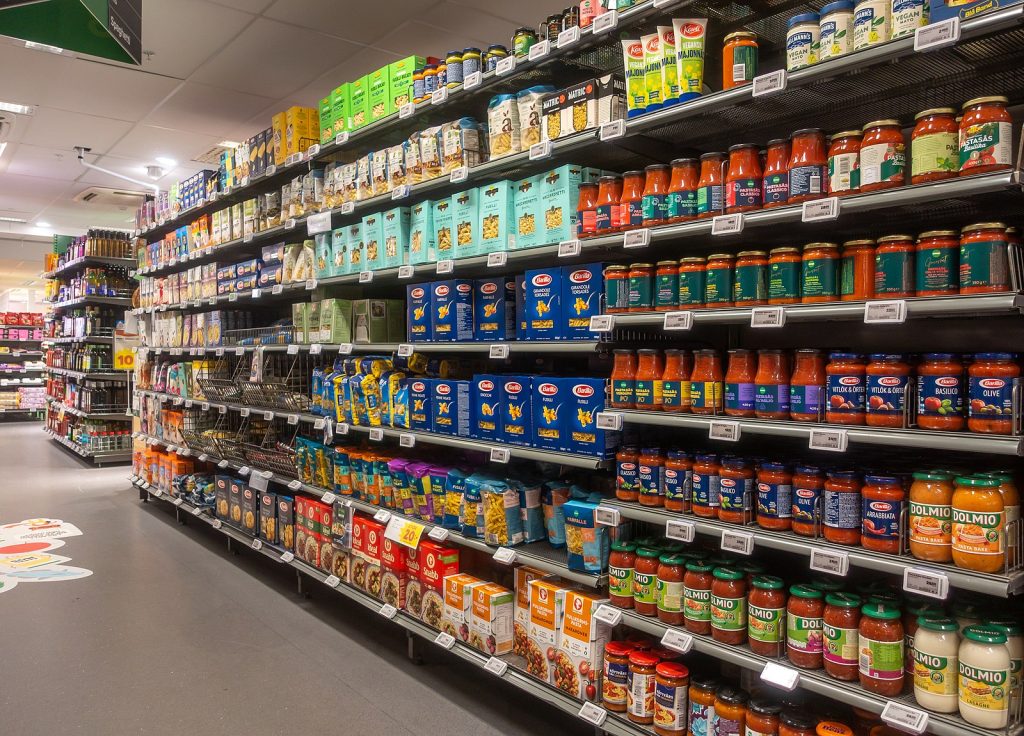
- Grocery store visit: Take a walk through the grocery store where you and your family typically shop, and on Datasheet 3 record your observations about the following aspects of the store:
-
- Biodiversity: What is the range of biodiversity represented in the food available? (i.e, describe the types and varieties represented in the produce, meat, and seafood)
- Food producers and food production: What information about food producers and food production is available? (i.e., who are the farmers/ranchers/fishers, and what is known about them and how they grow/raise/catch the food we eat?)
- Food choices: What type of food is available? (i.e., how much fresh produce, meat and seafood is there to take home to cook versus in-store prepared foods, versus processed and packaged food [canned, frozen, boxed, etc.] that is ready to eat or quick to prepare)
- Food marketing: How is the grocery store laid out and how is food marketed to shoppers? (i.e., how does the way food is organized in the store influence what people purchase, what kind of in-store marketing is directed at the food shopper, and what is the store encouraging shoppers to buy?)
- Food labeling and prices: How do claims on food packaging and food labels, and product prices influence shoppers? (i.e., how do claims on food packaging [e.g., organic, vegan, GMO free, fair trade, humane certified, etc.] and information available on food labels [about nutrition, calories, and ingredients] encourage food shoppers to purchase one brand over another, and how does the pricing of food items influence what gets purchased?)
- Answer the questions on the Lab Response.
References
Foodprint Calculator. (n.d.). Harvard T.H. Chan School of Public Health. Retrieved May 1, 2025, from https://harvard-foodprint-calculator.github.io/
Füleky, G. 2009. Cultivated plants, primarily as food sources. Encyclopedia of Life Support Systems, Volume 1. EOLSS Publishing, Oxford, United Kingdom. Retrieved from https://books.google.com/books?id=ZjzJDAAAQBAJ&pg=PA66#v=onepage&q&f=false
Ritchie, H., Rosado, P., and Roser, M. 2022. Environmental Impacts of Food Production. Our World in Data. Retrieved from https://ourworldindata.org/environmental-impacts-of-food
The Nutrition Source: Sustainability. (n.d.). Harvard T.H. Chan School of Public Health. Retrieved April 20, 2025, from https://nutritionsource.hsph.harvard.edu/sustainability/
Lab 10 Response: Exploring Your Foodshed
Download this Lab Response Form as a Microsoft Word document.
Directions: Use the information from your food audit (as recorded in Datasheets 1 and 2), your notes from your walk through the grocery store (as recorded in Datasheet 3), and other supporting information. In addition to the sources provided in the Lab Response below, you may use other credible resources, e.g., from your textbook or the internet. Embed citations within each response as appropriate. Provide complete citations for your resources, not simply URLs/web addresses.
Remember to submit Datasheet 1, Datasheet 2, and Datasheet 3 with your lab response.
Questions
- Research process and insights
How did you go about researching the information to complete Datasheets 1 and 2? Describe your research process and the sources you used. Which food items were easy to research? Which food items proved challenging? What information about your food was easy to find? What information was difficult to find? What does that tell you about our food system?
- The trophic level efficiency of your food choices
- Show your calculations and report the proportion of plant and animal sources represented in your food choices.
proportion of plant sources (%) =
proportion of animal sources (%) =
-
- At what trophic level do you predominantly eat – at the second trophic level (primarily eating plants) or at the third or higher trophic levels (primarily eating animals)? Apply the second law of thermodynamics and explain how efficient your food choices are in terms of energy flow, i.e., what are the consequences of eating at the trophic level that you do?
- The biodiversity impacts of your food choices
- Report total number of plant sources recorded in your 4-day food audit. Discuss if this number is typical for you. If not, how much more variety do you think your diet has? Provide a number and a rationale.
- Show your calculations and report the proportion of actively cultivated food crops in your diet (%):
- Show your calculations and report the calories from wheat in your diet (%) =
- Show your calculations and report the calories from corn in your diet (%) =
- Show your calculations and report the calories from rice in your diet (%) =
- Show your calculations and report the calories from potatoes in your diet (%) =
- According to agronomist György Füleky (2009), “There are 350,000 plant species in the world, and about 80,000 are edible for humans. However, at present only about 150 species are actively cultivated directly for human food or as feed for animals, and of these, 30 produce 95 percent of human calories and proteins. About half of our food derives from only four plant species: rice (Oryza sativa), maize (Zea mays), wheat (Triticum ssp.), and potato (Solanum tuberosum)” (p. 1). Discuss the ways in which your diet confirms and/or contradicts these facts about biodiversity in human diets. As part of your response, be sure to include supporting evidence from your calculations above.
- Considering both the proportion of your food that comes from plant versus animal sources, and the diversity of your plant sources, explain whether and how your food choices help to enhance biodiversity and/or undermine it. Use at least two specific examples to support your conclusions.
Here are a few sources to help you with your analysis:
-
-
- Our World in Data has several articles including Half of the world’s habitable land is used for agriculture, and To protect the world’s wildlife, we must improve crop yields — especially across Africa.
- The FoodPrint website offers the following discussion about Biodiversity and Agriculture.
-
- Impacts of food production, transportation, processing, and packaging
- From Datasheet 2: What did you learn about how your food is grown?
- From Datasheet 2: What did you learn about where your food is grown and how far it travels to get to you?
- From Datasheet 2: What did you learn about the processing and packaging involved in your food choices? Discuss things like the types of food processing involved, the predominant types of packaging, and whether the packaging is recyclable.
- Report the carbon, nitrogen, and water footprints associated with your food choices from the foodprint calculator:
-
-
- Carbon emissions:
- Nitrogen waste:
- Water consumption:
-
-
- Based on your assessment above (i.e., 4a-4d), reflect upon and discuss the environmental impact of your food choices. Were you surprised by these impacts? Are you concerned about these impacts? Which impacts concern you most? Explain your thinking. Use at least three specific examples to support your conclusions.
There are several sources that can help you with your analysis:
-
-
- Our World in Data has several charts as well as brief articles that explore the environmental impacts of food production, such as the connection between food production and greenhouse gas emissions, food transportation, and organic versus conventional agriculture.
- The Water Footprint Calculator has information on the waterfootprint of your food.
- The FoodPrint website offers information about various food- and agriculture-related issues such as how agriculture contributes to water pollution and the environmental impact of food packaging.
- Center for Sustainable Systems at the University of Michigan provides a couple of factsheets on the U.S. Food System as well as food footprints.
- Oregon’s Department of Environmental Quality has two reports on food transportation and food packaging.
-
- How the marketplace shapes your diet
From Datasheet 3: Summarize and discuss what you learned about food choices available in the marketplace. What did you learn about food choices and how you (and your family) shop for food? What factors are important to you when you (and your family) shop for food? How do food labels, store marketing, prices, etc. influence how you shop? Were you surprised by anything you learned? Explain your thinking. Use at least three specific examples to support your conclusions.
- Industrial versus responsible eating
- In The Pleasures of Eating, Wendell Berry distinguishes between what he calls “industrial” and “responsible” eaters. Briefly define the two categories, “industrial eater” and “responsible eater,” as you understand them after reading the essay.
- After reviewing your diet for this lab, would you consider yourself a “responsible” eater? An “industrial” eater? Something between the two? Something besides these two (a category of your own)? Explain your choice. As part of your response, also reflect on the basis for your diet choices (i.e., why do you eat what you eat and eat it in the way that you do).
- How does the marketplace, as revealed in the grocery store you explored, support “industrial” or “responsible” eating? Explain your response.
- Lab analysis and reflection
- Based on what you learned about the environmental impact of your food choices would you recommend your food choices? Explain and support your recommendation using data you obtained and analyzed in the course of doing this lab, which included: the trophic level efficiency of your food choices; the biodiversity impacts of your food choices; and the environmental impacts of your food choices, like how your food is grown, processed, and packaged, and how far it travels. Use at least four specific points of evidence to validate your recommendation.
- How could you reduce the environmental impact of your diet and become a more “responsible” eater? Identify three ways. Besides the resources you have already reviewed in this lab, here are some additional sources that can help you with this question as well as the last one:
-
- How could the marketplace promote more “responsible” eating? Identify two ways.
References
Biodiversity and Agriculture. 2024. FoodPrint, GRACE Communications Foundation. Retrieved from https://foodprint.org/issues/biodiversity-and-agriculture/
Center for Sustainable Systems, University of Michigan. 2024. U.S. Food System Factsheet. Pub. No. CSS01-06. Retrieved from https://css.umich.edu/publications/factsheets/food/us-food-system-factsheet
Center for Sustainable Systems, University of Michigan. 2017. Food Footprints Factsheets. Pub. No. CSS17-43. Retrieved from https://css.umich.edu/publications/factsheets/food/food-footprints
Change Your Diet. (n.d). Water Footprint Calculator. Retrieved May 1, 2025, from https://watercalculator.org/how-to-save-water/change-your-diet/
Eating Sustainably. (n.d). FoodPrint, GRACE Communications Foundation. Retrieved May 1, 2025 from https://foodprint.org/eating-sustainably/
Füleky, G. 2009. Cultivated plants, primarily as food sources. Encyclopedia of Life Support Systems, Volume 1. EOLSS Publishing, Oxford, United Kingdom. Retrieved from https://books.google.com/books?id=ZjzJDAAAQBAJ&pg=PA66#v=onepage&q&f=false
Heller, M. 2017. Food Product and Environmental Footprint Literature Summary: Packaging and Food Waste. State of Oregon, Department of Environmental Quality. Retrieved from https://www.oregon.gov/deq/FilterDocs/PEF-Packaging-FullReport.pdf
Heller, M. 2017. Food Product and Environmental Footprint Literature Summary: Food Transportation. State of Oregon, Department of Environmental Quality. Retrieved from https://www.oregon.gov/deq/FilterDocs/PEF-FoodTransportation-FullReport.pdf
How Industrial Agriculture Affects Our Water. 2024. FoodPrint, GRACE Communications Foundation. Retrieved from https://foodprint.org/issues/how-industrial-agriculture-affects-our-water/
Plate and the Planet. (n.d.) Harvard T.H. Chan School of Public Health. Retrieved April 29, 2025, from https://nutritionsource.hsph.harvard.edu/sustainability/plate-and-planet/#planetary-health-diet
Ritchie, H., Rosado, P., and Roser, M. 2022. Environmental Impacts of Food Production. Our World in Data. Retrieved from https://ourworldindata.org/environmental-impacts-of-food
Ritchie, H. 2021. To protect the world’s wildlife, we must improve crop yields — especially across Africa. Our World in Data. Retrieved from https://ourworldindata.org/yields-habitat-loss
Ritchie, H. and Roser, M. 2019. Half of the world’s habitable land is used for agriculture. Our World in Data. Retrieved from https://ourworldindata.org/global-land-for-agriculture
The FoodPrint of Food Packaging. 2024. FoodPrint, GRACE Communications Foundation. Retrieved from https://foodprint.org/reports/the-foodprint-of-food-packaging/
Water in Your Food. (n.d). Water Footprint Calculator. Retrieved May 1, 2025, from https://watercalculator.org/water-footprints-101/water-in-your-food/
