Lab 13: Our Changing Climate: Science, Solutions, and Ecosystem Effects
Introduction
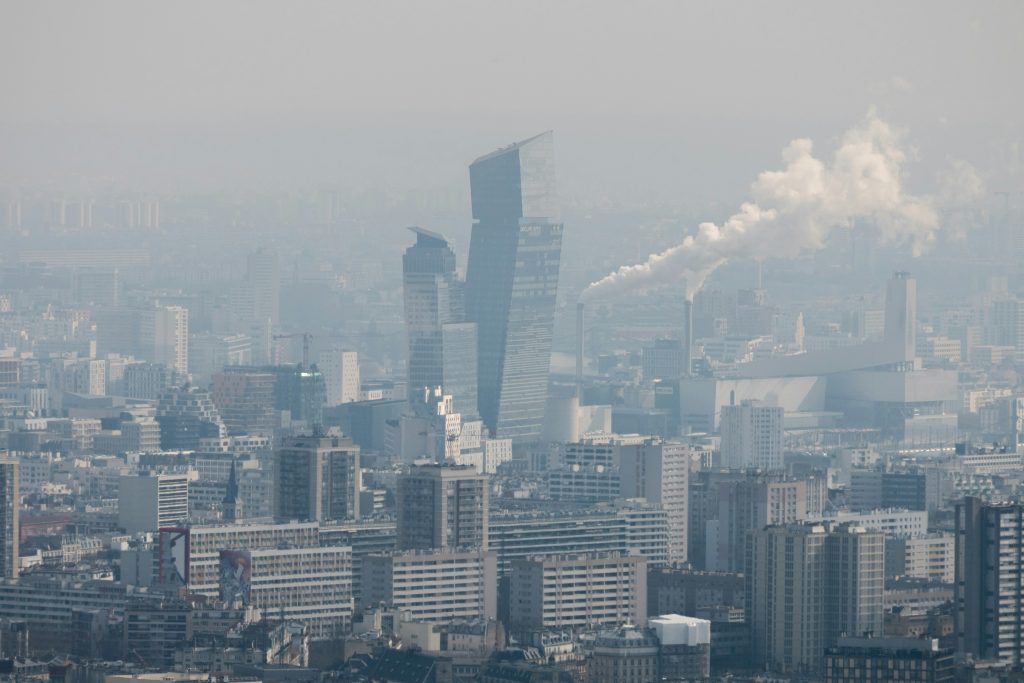
Climate change is one of the most significant environmental challenges facing the planet today. It refers to long-term changes in temperature, precipitation patterns, and extreme weather events. The recent, rapid changes to our climate have been caused by human activities (Figure 13.1), especially due to the burning of fossil fuels. These changes are altering ecosystems and biodiversity in profound ways.
Lab Objectives
In this lab, you will:
- Understand the scientific basis of climate change and its effects on ecosystems.
- Analyze how species and ecological communities might shift in response to climate change.
- Compare strategies to reduce global temperature increase over the 21st century.
Part 1: Factors Contributing to Climate Change
The Intergovernmental Panel on Climate Change (IPCC) is an international team providing scientific assessments of climate change and its risks, and potential mitigation strategies. The IPCC was created by the United Nations in 1988 and is made up of hundreds of scientists who assess thousands of scientific papers to issue their reports (IPCC 2025). The United States also issues a National Climate Assessment to examine the effects of climate change on the nation. It is made up of several hundred expert volunteers under the federally mandated U.S. Global Change Research Program (USGCRP 2018). You will use information and data generated by these organizations to understand the fundamentals and infer causes of Earth’s current changing climate.
U.S. Global Change Research Program
- Watch the short video Climate Change 2021, which introduces the Intergovernmental Panel on Climate Change’s Sixth Assessment Report.
- Next, explore the United Nations Climate Action site, What is Climate Change.
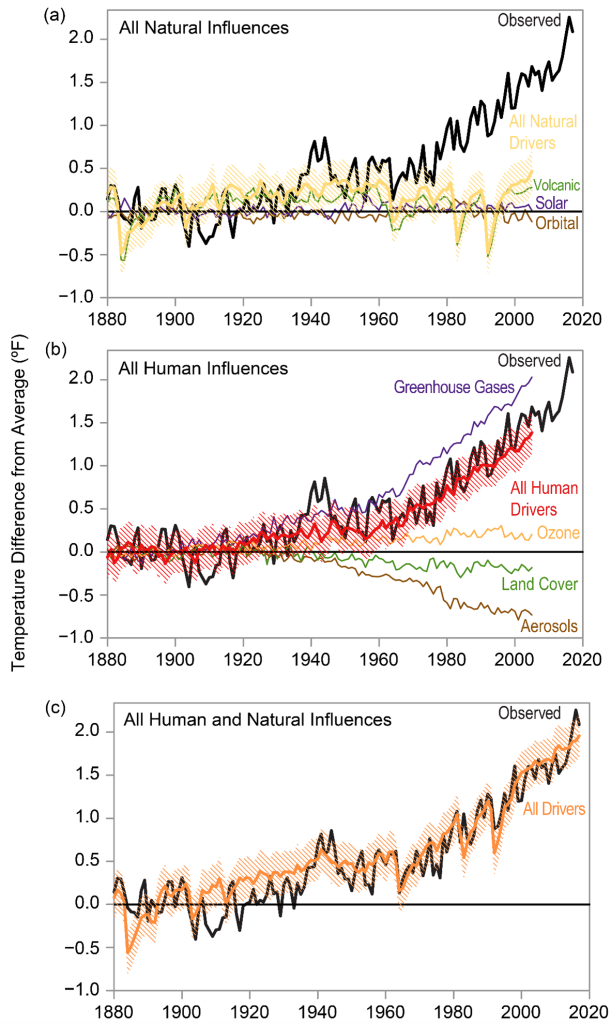
- Compare observed and modeled changes to Earth’s global temperature over the past 240 years, starting around the time of the Industrial Revolution (Figure 13.2).
- Answer the questions in Part 1 of the Lab Response Form.
Part 2: Ecosystem and Climate Interactive
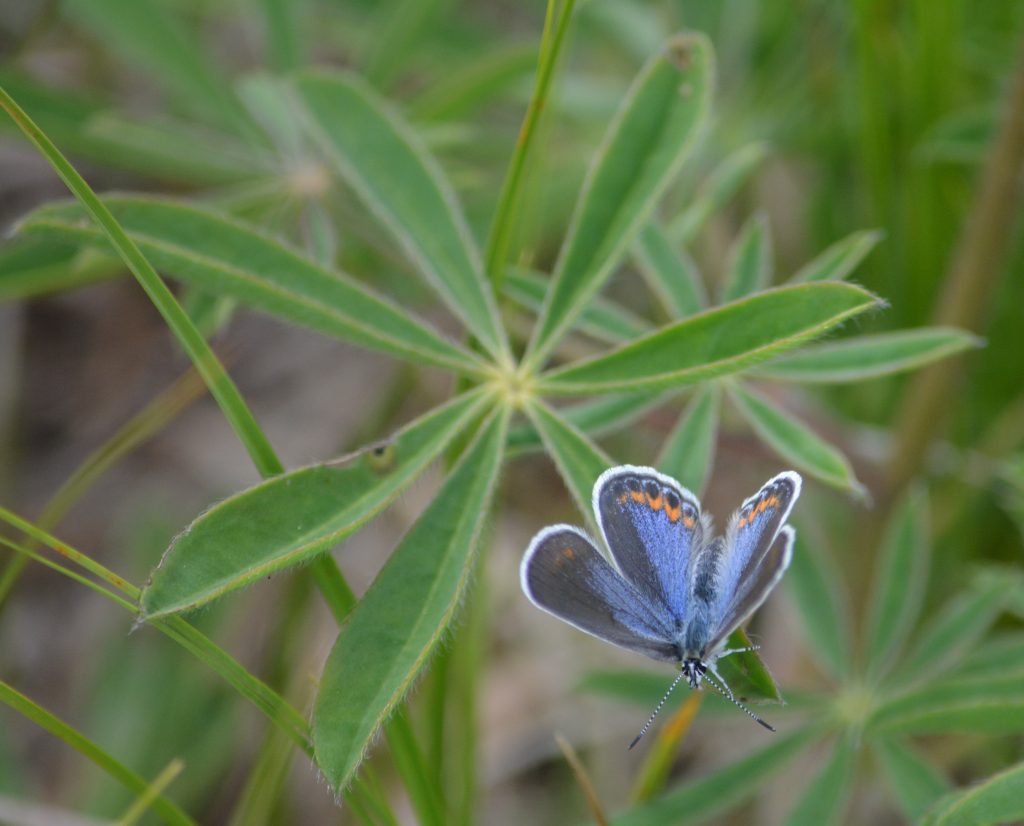
In this part of the lab, you will observe the life cycle connections between two organisms, then assess how changes to the climate affect this relationship and their population sizes. Featured in this simulation is the Karner blue butterfly (Figure 13.3), a federally endangered insect. It lives in the Great Lakes region of the United States in habitats that support wild lupines. The butterflies depend on these plants for their survival. As these habitats and plants have decreased over time, so too has the population of butterflies. Climate change presents an additional challenge. Changes in average temperatures affect the growth and development of organisms and the timing of certain life cycle events. The study of this timing is called phenology.
- Go to the simulation Phenology of the Karner Blue Butterfly. Read the background on this butterfly and lupine plants. Answer question 1 on Part 2 of the Lab Response Form.
- Select “Simulation” at the top of the page to access the computer simulation. Observe and model settings. Global temperature anomaly refers to the change in degrees Celsius from historic levels. Clutch size refers to the number of eggs a female butterfly can lay at once. Initial overwinter eggs are the starting number of eggs laid by all female butterflies. Relative habitat size ranges from 0–1, with 1 being the current available habitat; values less than that indicate the proportional amount of habitat lost. Without changing settings, select the button “Run.” View the resulting graphs. Answer questions 2-3 on Part 2 of the Lab Response Form.
- Reset the simulation. Move the slider “Global Temperature Anomaly” to increase the overall air temperature by 1 degree Celsius. Run the simulation and answer questions 4-5 on Part 2 of the Lab Response Form.
- Reset the simulation. Move the slider “Global Temperature Anomaly” to increase the change in overall air temperature to a value of your choosing that is >1. Consider what you have learned about climate change thus far and be prepared to justify your temperature choice. Also compare the results of your previous temperature change to the original phenology of the system. Hypothesize how your new temperature will affect the synchrony of the lupine and butterfly life cycles. Record your hypothesis in question 6 on Part 2 of the Lab Response Form. Then, run the simulation with your new temperature setting and answer questions 7-8 on Part 2 of the Lab Response Form.
- Reset the simulation. Change other settings, one at a time, and in combination. Answer question 9 on Part 2 of the Lab Response Form.
Part 3: Climate Solutions Simulation
Climate change is rapidly altering the ecosystems on which humans depend, driving the need to generate efficient and realistic solutions. In this part of the lab, you will use a climate solutions tool, developed by system dynamics modelers, to manipulate factors contributing to climate change and evaluate your options.
- Go to Climate Interactive’s En-ROADS Climate Solutions page and click the box “Explore the En-ROADS Simulator.”
- Go to the Help menu at the top of the screen and choose “Related Examples” from the drop-down list. Read over the different items in the legend below the graphs to familiarize yourself with what you can manipulate in this interactive. Answer questions 1-2 in Part 3 of the Lab Response Form.
- Close the legend by clicking the X at the top right of the legend. The sliders for each item should again be visible.
- Manipulate the sliders for one major policy sector (energy supply, transport, buildings and industry, growth, carbon dioxide removal, other sources of greenhouse gases) at a time. Fill in Table 13.1 and answer questions 4-5 in Part 3 of the Lab Response Form.
- Choose two policy sectors to manipulate that you think will give you the best (lowest) greenhouse gas emissions and temperature change. Answer questions 6-7 in Part 3 of the Lab Response Form.
References
Climate Interactive and MIT Sloan School of Management. 2025. En-ROADS version 25.4.0 https://en-roads.climateinteractive.org/scenario.html?v=25.4.0
Darkow, J. 2019. Phenology of the Karner Blue Butterfly. Isee Exchange. https://exchange.iseesystems.com/public/jondarkow/phenology-of-the-karner-blue-butterfly/index.html#page3
Hayhoe, K., D.J. Wuebbles, D.R. Easterling, D.W. Fahey, S. Doherty, J. Kossin, W. Sweet, R. Vose, and M. Wehner, 2018: Our Changing Climate. In Impacts, Risks, and Adaptation in the United States: Fourth National Climate Assessment, Volume II [Reidmiller, D.R., C.W. Avery, D.R. Easterling, K.E. Kunkel, K.L.M. Lewis, T.K. Maycock, and B.C. Stewart (eds.)]. U.S. Global Change Research Program, Washington, DC, USA, pp. 72–144. doi: 10.7930/NCA4.2018.CH2
The Intergovernmental Panel on Climate Change (IPCC). 2025. About the IPCC. https://www.ipcc.ch/about/
Intergovernmental Panel on Climate Change Sixth Assessment Report. 2021. Climate Change 2021: The Physical Science Basis (Trailer) https://www.youtube.com/watch?v=I1Vx_a6F57Q
United Nations Climate Action. What is Climate Change? https://www.un.org/en/climatechange/what-is-climate-change accessed April 5, 2025.
USGCRP, 2018: Impacts, Risks, and Adaptation in the United States: Fourth National Climate Assessment, Volume II [Reidmiller, D.R., C.W. Avery, D.R. Easterling, K.E. Kunkel, K.L.M. Lewis, T.K. Maycock, and B.C. Stewart (eds.)]. U.S. Global Change Research Program, Washington, DC, USA, 1515 pp. doi: 10.7930/NCA4.2018.
Lab 13 Response: Our Changing Climate
Download this Lab Response Form as a Microsoft Word document.
Part 1 Questions
- Per the video, humans have not experienced climate warming to this extent in at least ____________ years. Explanations for current climate change are based on over __________________ scientific publications.
- What is the greenhouse effect? What are key greenhouse gases and their anthropogenic (human-based) sources?
- How is the climate changing and what problems do these changes create for humans?
- Study Figure 13.2. Compare each graph and explain whether human or natural drivers, and which types, contribute more to average global temperature change.
Part 2 Questions
- Explain which butterfly life stages are directly dependent on lupine plants.
- Insert a screenshot of the simulation page showing your graph of Phenology of the System with the default settings.
- Describe the butterfly life stages that overlap with “realized lupine,” the population sizes of each organism, and the relationships to the trend in the air temperature of the system.
- Insert a screenshot of the simulation page showing your graph of Phenology of the System with the 1-degree Celsius temperature change.
- Explain how the 1-degree Celsius temperature change affected the system, including phenology of the organisms.
- Hypothesize how your new temperature will affect the phenology and population sizes of the butterfly and lupine.
- Insert a screenshot of the simulation page showing your graph of Phenology of the System with your unique temperature setting.
- Explain your results. Did they support your hypothesis?
- Describe other settings you changed and the results you obtained. Based on your trials, which settings appeared to have the greatest impact on butterfly population size?
- You saw the impacts of temperature change on the butterfly population. Discuss potential long-term effects on lupines and the extent to which butterflies might influence this.
Part 3 Questions
- What is the projected temperature change at the end of the 21st century in the baseline scenario?
- Is global primary energy projected to increase, decrease, or remain the same through the end of this century? What trends do you see in the types of major energy sources used over this time period?
- Table 13.1: Results of En-ROADS model manipulations on net greenhouse gas emissions and global temperature change.
| Policy Sector | Global Temp. Change in 2100 | Greenhouse Gas Net Emission in 2100 | Greatest contributing factor and how it was changed |
|---|---|---|---|
| Energy Supply | |||
| Transport | |||
| Buildings and Industry | |||
| Growth | |||
| Carbon Dioxide Removal | |||
| Other Sources of Greenhouse Gases |
- Include a screenshot of the En-ROADS scenario yielding the greatest reduction in greenhouse gas emissions and global temperature, changing variables in only one policy/sector at a time.
- Which policy change and factor resulted in the greatest reduction of greenhouse gas emissions and global temperature change? How difficult do you think it would be to achieve?
- Which policies did you choose to manipulate and why? What was the lowest reduction in greenhouse gas emissions you achieved? What was the temperature change in 2100?
- Explain how realistic you think it will be to achieve this scenario. Describe challenges you perceive in international cooperation and standard of living changes.
