1 Scientific Thinking and Method
Download this lab as a Microsoft Word document.
Download the lab response form (Microsoft Word document) to access the questions only.
Purpose
The purpose of this activity is to ensure that all students understand how to connect and apply the steps of the scientific method and thinking.
Learning Objectives
At the conclusion of this exercise, students will be able to:
- Create an experiment and apply the steps of the scientific method to the experiment.
- Identify appropriate control and experimental groups in an experiment.
- Distinguish the independent and dependent variables in an experiment.
- Calculate the statistical measures mean, mode, median, and standard deviation.
- Create and interpret an accurate graph.
- Make a conclusion based on the results and justify it with an evidence-based argument.
Why It’s Relevant
The scientific method is a framework for critical thinking and problem solving, and we can use it to make decisions in our daily lives. For example, should you get vaccinated, and what are the pros and cons of vaccines? Additionally, you will develop soft skills like communication (oral and written) and teamwork/relationship-building (in-person), which are imperative skills in any career.
Introduction
Our knowledge of biology grows when scientists ask questions like “How does climate change increase extreme weather events?” or “How is deoxyribonucleic acid (DNA) used to solve crime and exonerate falsely accused convicts?” or “Why do certain foods increase the chances of heart disease?” Scientists think of some possible answers but rarely accept them without collecting data first. An efficient and effective approach to answer such questions is to use the scientific method. The scientific method is a comprehensive and flexible process that involves curiosity, hypothesizing, observations, testing, and measurement. Common steps involved in this method are:
- Making observations
- Creating a question
- Forming a hypothesis
- Designing an experiment
- Collecting and analyzing data
- Drawing a conclusion
- Re-testing/revising any of the steps
These steps allow for a series of trial-and-error experiments and are often executed in collaboration with other researchers. The aim of the scientific thinking and method is to provide an objective and verifiable approach to gain knowledge about the natural world. Not only has this method led scientists to understand biology and the content of this course, but scientists also apply this knowledge to innovate and solve problems. It is very similar to making daily life decisions that are important to you!
You (and your lab partner, if you have one) will design and perform a quick and simple scientific experiment with resources you have in your current environment.
Below are some examples of past students’ experiments:
- How does exercise activity duration affect heart rate?
- Does dropping an object from different heights affect how fast it falls?
- How many trials does it take to learn a maze?
- Does meditation or calming music decrease breathing rate?
Materials for In-Person Courses
The instructor will inform you of the equipment that is available.
Alternative Materials for Online Courses
Look around your home for equipment you can use to create a simple experiment.
Curiosity and Inquiry
The scientific method typically begins with curiosity and inquiry, which drive scientists to discover new things about the world around them. A scientist begins by asking a question, which is usually derived from previous knowledge and observations. As mentioned before, you (and your lab partner, if you have one) will design and perform a quick and simple scientific experiment with resources you have in your current environment. That said, you are the curious and inquisitive scientist today, so begin by answering the following questions:
- What previous knowledge or observations (from readings, personal experience, previous coursework, etc.) inspired your question?
- What is the question that you wish to investigate?
Before moving on, check your question with your instructor to confirm that it is reasonable to investigate given your limited time and resources.
Formulating a Hypothesis
After a question is developed, scientists form a potential answer to the question, which is known as the hypothesis. A hypothesis is a proposed explanation of a phenomenon within the natural world. It is based on previous knowledge and must be testable through experimentation. Additionally, a prediction is what you expect to happen in a specific situation (i.e., the expected results of your experiment). With this in mind,
- What is your hypothesis?
- What are your predictions?
Testing the Hypothesis: Designing an Experiment
To test a hypothesis, scientists design an experiment and consider several variables. A variable is a factor, trait, or condition that can be controlled, changed, or measured in an experiment. The two categories of variables are independent and dependent, which by definition have a cause-and-effect relationship. An independent variable is a factor that may cause an effect that can be observed and measured in the dependent variable. The independent variable is a factor that the scientist purposely changes over the course of the experiment. Stated simply, changes observed in a dependent variable (the effect) depend on changes made to an independent variable (the cause). For example, room temperature (independent variable) can effect a change in the amount a person sweats (dependent variable), but the amount a person sweats does not cause a change in room temperature.
To ensure that the scientist is truly observing effects due to changes in the independent variable, there generally needs to be a comparison between a control group (in which the independent variable is held constant) and an experimental group (in which the independent variable is changed). The control group provides a baseline measure of the dependent variable for comparison with the experimental group. In other words, the baseline measure is the data before any intervention has occurred. If possible, these two groups should be identical to one another except for the independent variable.
Throughout the semester, you will be analyzing and interpreting various experimental designs and will be asked to make connections between variables. The ability to identify the independent and dependent variables (as well as the control and experimental groups) will provide you with the necessary context for data collection. This will also allow you and your team to draw sound and valid conclusions.
- Before your team designs an experiment, practice identifying the independent and dependent variables as well as the control and experimental groups in the scenario below:
A group of scientists perform an experiment to test the activity of a new enzyme at various levels of acidity (pH). They put a known amount of the enzyme in a test tube, set the pH to neutral, and then measure the enzyme activity. They then decrease the pH and re-measure the enzyme activity. They continue this process until they have several data points.
In this experiment, what is the:
-
- Independent variable:
- Dependent variable:
- Control group:
- Experimental group:
- Design an experiment to test your group’s hypothesis.
- What are the independent and dependent variables? Helpful tip: For time management, choose 1 independent variable and 1 dependent variable for your experiment. For example, room temperature (1 independent variable) affects the amount a person sweats (1 dependent variable), instead of room temperature (1 independent variable) affects the amount a person sweats and their heart rate (2 dependent variables).
- What is the control group?
- What is the experimental group?
Another important factor in designing an experiment is the sample size of the groups. Sample size is the number of data points, observations, subjects, or replicates that are collected in each control and experimental group. It is used to make an inference about a population. The scientist will try to maximize the sample size (given their time, availability of resources, funding, etc.) because a larger sample size improves the accuracy, validity, and generalizability of the results. Furthermore, random sampling provides a more accurate representation of the population and reduces sampling error or bias. Random sampling is a technique used to select a subset of individuals from a larger population in such a way that every member has an equal chance of being chosen. For example, the claim that a drug has 80% efficacy in 100 patients is not as powerful as the claim that it has 80% efficacy in 1000 patients.
- That said, what are the sample sizes of your control and experimental groups? How many subjects will be in each group? How will you choose your subjects? Will you include any replications?
Before moving on, check your experimental design with your instructor to confirm that you are on the right track.
Testing the Hypothesis: Data Collection
Once the experimental design is complete, the scientist will start collecting data.
- Below is a data table to keep track of your data.
| Column 1 | Column 2 | Column 3 | Column 4 | Column 5 |
|---|---|---|---|---|
Interpreting the Data: Simple Statistical Analysis of Results
After data is collected, the scientist will make meaning of the results using statistics. Statistics is a discipline of mathematics that deals with interpreting, analyzing, and organizing data in order to identify patterns, make informed decisions, and draw conclusions. The most used statistical measures are the mean, mode, median, and standard deviation.
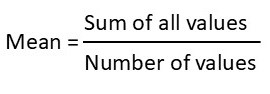
Mean is the average of the set of numbers. To calculate this, you add all the numbers together and then divide by the sample size:
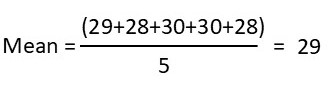
Calculation example:
Data set 1: 29, 28, 30, 30, 28
However, the mean is not always the most reliable measure, since datasets with different spreads can still have the same mean. For example,
Data set 1: 29, 28, 30, 30, 28
Mean = 29
Data set 2: 3, 19, 15, 28, 80
Mean = 29
The mode is the most frequently occurring number in the data set. In other words, it is the most common result. For example, in retail, the mode is helpful to identify which clothing item is purchased most by customers. For example,
Data set 1: 29, 28, 30, 30, 28
Mode = 28 or 30
The median is the middle number of a set when the data is arranged in ascending or descending order. If there is no middle number (because there are an even number of items in the set), then the median is the mean of the two numbers closest to the middle. For example, a hospital will report the median wait time, as this reflects the typical patient experience, even if some have waited for unusually long times:
Data set 1: 29, 28, 30, 30, 28
Median = 29
Data set 2: 3, 19, 15, 28, 80
Median = 15
Standard deviation measures how spread out the data is around the mean and indicates the level of variability within the dataset. For example, a basketball player’s average points per game is 20, with a standard deviation of 5. If the standard deviation is high, then the player’s performance varies widely (in some games, the player scores very few points, while in other games they score many points). The coach can use standard deviation to assess the player’s consistency in performance.
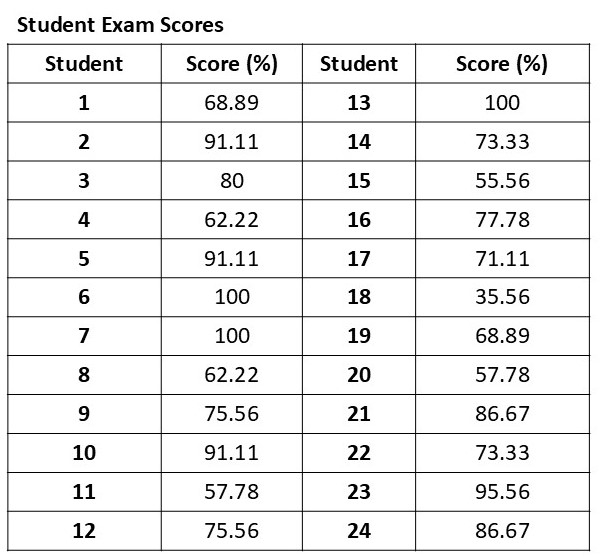
Before you statistically analyze your data, practice calculating and identifying the various statistical measures using the data below (Table. 1.1). Your instructor will inform you if they wish for you to manually or automatically calculate the measures. Refer to Appendix 1 for instructions on using Google Sheets to calculate statistical measures to automatically calculate. However, you can use any program that you are most comfortable with.
- Using the data in Table 1.1 below, answer the following questions:
-
- What is the mean?
- What is the mode?
- What is the median?
- What is the standard deviation?
Visualizing the Data: Graphing and Understanding Relationships in Results
Another way to identify patterns in the data is to represent the data as a graph. A simple graph typically represents the relationship between the independent and dependent variables. Conventionally, a graph will include the following:
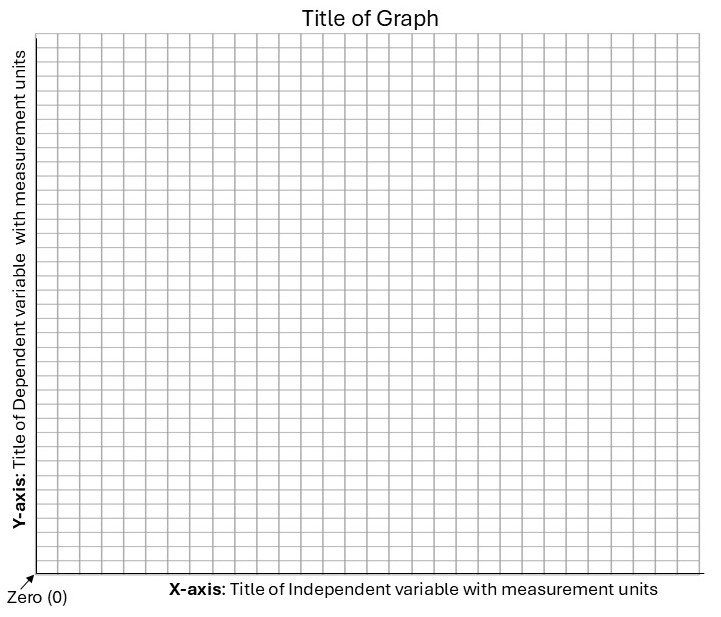
Axis
- X-axis: Horizontal line where the independent variable is labeled with the measurement units
- Y-axis: Vertical line where the dependent variable is labeled with the measurement units
- The intersection of the x-axis and y-axis represents “zero”
- Each axis should have an appropriate scale and be divided into uniform increments with a consistent numbering system
Title of Graph
- A description of the whole graph
For example,
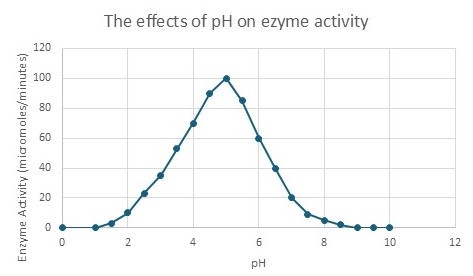
- Now plot the data that your group collected below. Label the x and y axes and choose the appropriate number scale for each axis. Your instructor will inform you if you should manually or automatically create the graph. Refer to Appendix 1 for instructions on using Google Sheets to create graphs with standard deviation bars. However, you can use any program that you are comfortable with. Helpful tip: Apply your knowledge about independent and dependent variables when labeling the axes.

Making a Conclusion
After analyzing data, scientists draw conclusions, and their original hypothesis will either be accepted, rejected, or revised based on the results. Additionally, they interpret what the data may mean. After interpretation of the data, the original scientist (and other scientists) will plan additional experiments to confirm, disprove, or revise the conclusions to create a shared biological theory.
- Do the results validate or reject your group’s hypothesis? Why or why not?
- What is the group’s interpretation of the data and conclusions? Are there any resources or previous knowledge that support your team’s interpretation and conclusions?
- What are some strengths of your experiment?
- What are some weaknesses of your experiment?
- Based on your weaknesses, how would you improve your experimental design?
- What additional experiments might be done to confirm or refute your group’s conclusions?
References
Phelan J. 2021. What is life? A guide to biology with physiology. 5th ed. New York (NY): W.H. Freeman.
Russell PJ, Hertz PE, McMillan B. 2014. Biology: the dynamic science. 4th ed. Belmont (CA): Cengage Learning.
IUPAC. 2018. Terminology of bioanalytical methods (IUPAC Recommendations 2018). Chem Int. 40(3):34.
A comprehensive and flexible process of examination and discovery of natural phenomena.
A proposed explanation of a phenomenon within the natural world.
The expected results of an experiment.
A factor, trait, or condition that can be controlled, changed, or measured in an experiment.
A factor that may cause an effect that can be observed and measured in the dependent variable.
A factor that is an effect that can be observed and measured which may be caused by the independent variable.
Group of data points, observations, or subjects that Is not exposed to the condition that is being studied but otherwise treated identically to the experimental group.
Group of data points, observations, or subjects that Is exposed to the condition that is being studied but otherwise treated identically to the control group.
The number of data points, observations, subjects, or replicates that are collected in each control and experimental group.
A technique used to select a subset of individuals or observations from a larger population in such a way that every member has an equal chance of being chosen.
A discipline of mathematics that deals with interpreting, analyzing, and organizing data in order to identify patterns, make informed decisions, and draw conclusions.
The average of the set of numbers.
The most frequently occurring number in the data set.
The middle number of a set when the data is arranged in ascending or descending order.
The spread of the data is around the mean and indicates the level of variability within the dataset.
A visualization to present, interpret, and summarize data.
The horizontal axis of a graph.
The vertical axis of a graph.
