12 Investigating Evolutionary Relationships with BLAST
Download this lab as a Microsoft Word document.
Download the lab response form (Microsoft Word document) to access the questions only.
Purpose
To analyze species relationships using DNA and protein evidence.
Learning Objectives
At the conclusion of this exercise, students will be able to:
- Interpret phylogenetic tree diagrams.
- Construct a phylogenetic hypothesis based on a comparison of DNA samples.
- Perform a BLAST search to analyze evolutionary relationships using Cytochrome c (CYC) amino acid sequences from the NCBI database.
Why It’s Relevant
There are over one million different types of organisms on Earth. Have you ever wondered where you fit in among this vast diversity of life? If so, you’re engaging in a fundamental aspect of biology. Biologists strive to understand the unique characteristics of species and their relationships to one another. By studying these connections, scientists can support conservation efforts, establish a common language for classification, and trace the origin of specific traits.
Introduction
Life on Earth appears to be endlessly diverse, when in fact species are more similar than you might imagine. The observable differences of Earth’s biological diversity are often simply a product of minor tweaks to a master template. Over time, accumulated change has allowed some species to show greater deviation from the mold, but the entire evolutionary pathway remains connected. The clearest evidence supporting this statement is the primary tenet of cell theory, which states that all cells arise from preexisting cells. Based on this fact, every species is related either recently or distantly. Scientists use this basic premise to organize the relationships of living things on Earth.
The technical term for organizing species into groups based on their evolutionary history is called phylogeny. Phylogenies are constructed by calculating the probability of two species sharing a recent ancestor through the analysis of genetic, morphological, and ecological similarity. Phylogenies are hypotheses and, therefore, must be falsifiable. The hypothesis with the highest probability of logical relationships is said to be parsimonious, which means it is highly likely to have occurred based on the evidence. Parsimony is calculated using computer algorithms that compare a variety of data across many different samples to conclude the most probable evolutionary tree. Phylogenetic trees that are most likely to be accepted exhibit the fewest number of evolutionary events across species. This is because it is more likely that a complex trait like the eyeball evolved only once rather than appearing independently several times. Could you imagine the eyeball being a uniquely evolved entity in humans, pigs, chickens, and whales? Any common trait might be mistaken for evolving separately across hundreds of thousands of species. While possible, repeated evolution of the same traits across different lineages is less common because it not only requires similar mutations, but also the same environmental selective pressures. Generally, the more complex a trait, the less likely it is to have evolved more than once, and the more likely it is the result of common descent. Interestingly, you wouldn’t think multicellularity is a simple trait, but evidence suggests that multicellularity evolved separately in plants, animals, and fungi.
Molecular data, such as RNA, DNA, and protein sequences, have increased the power and accuracy of phylogenetic analyses. These data are freely available for anyone to analyze in electronic databases. One such database, hosted by the National Library of Medicine, is called the National Center for Biotechnology Information (NCBI). The NCBI database serves as a repository of sequences and makes various tools available for scientists to query the data for analysis. The Basic Local Alignment Search Tool (BLAST) is a program that finds regions of similarity between biological sequences and calculates the statistical significance. A higher level of statistical significance suggests homology and shared ancestry can be inferred. This is useful for identifying homologous sequences and discovering evolutionary relationships.
To adequately compare species, scientists must select highly conserved nucleotide sequences for analysis. Conserved regions of code have not changed much throughout evolutionary history. By studying code that has been less likely to experience change, scientists can infer relationships among species based on quantifiable differences. Highly conserved nucleotide sequences tend to be critical for survival across a broad range of species. Any change to a gene encoding a critical function of survival is likely to be minimally accumulated over time, since large changes might cause extinction. It’s easy to track and assign small changes when they appear in specific groups. An example of a highly conserved gene is Cytochrome c, which produces a critical oxidizing enzyme used during aerobic cellular respiration. Since many species possess this gene, it is a good model for evolutionary and phylogenetic studies. By comparing multiple species’ Cytochrome c gene, scientists can map the degree of homology across multiple lineages. This may also help create a timeline of evolutionary changes. To ensure the inferred relationships are not arbitrary, scientists compare species at several highly conserved gene sites. In this lab, you will study the homology of Cytochrome c across several lineages. This lab activity was inspired by concepts presented in activities by Adams (2020) and Hanson (2012).
Part 1. Interpret phylogenetic tree diagrams
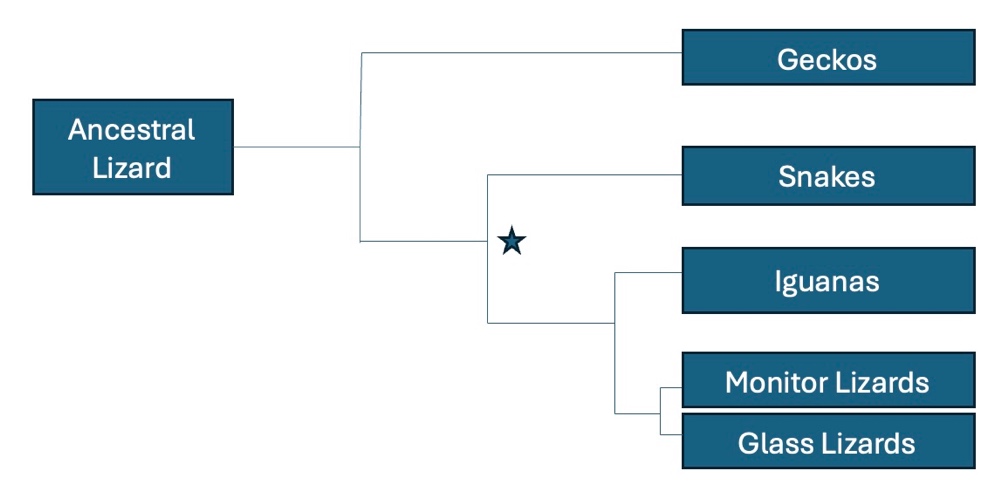
- In a complete sentence, describe what the branch points and lines in a phylogenetic tree represent.
- List all modern descendants of the organism that was alive at the point indicated by the asterisk.
- According to the tree above, what animal is most closely related to the ancestral lizard?
- Which are more closely related, the snakes and glass lizards or the iguanas and glass lizards? Explain your reasoning.
- Circle the point on the tree that represents the most recent common ancestor of iguanas and monitor lizards.
Part 2. Compare DNA samples across multiple lineages to establish homology
The four sequences below represent a single gene where nucleotides from different species are aligned to the same position within the gene. Each sequence encodes the same molecule essential for protein synthesis in all five species. Compare sequences 1-4 to the ancestral sequence by reviewing the character matrix and completing the numeration table.
- Species 1: CAGTTTGGACCTAACAGCTTC
- Species 2: GATTCGGAACTTCGTGGTTAC
- Species 3: CACTTTGGATGTAGCAGGTTT
- Species 4: GTTTCAGAACTTGGTGCTATC
- Ancestral sequence: CACTTTGGAAGTAGCAGGTTC
|
Base Pair Site |
1 |
2 |
3 |
4 |
5 |
6 |
7 |
8 |
9 |
10 |
11 |
12 |
13 |
14 |
15 |
16 |
17 |
18 |
19 |
20 |
21 |
|---|---|---|---|---|---|---|---|---|---|---|---|---|---|---|---|---|---|---|---|---|---|
|
Species 1 |
C |
A |
G |
T |
T |
T |
G |
G |
A |
C |
C |
T |
A |
A |
C |
A |
G |
C |
T |
T |
C |
|
Species 2 |
G |
A |
T |
T |
C |
G |
G |
A |
A |
C |
T |
T |
C |
G |
T |
G |
G |
T |
T |
A |
C |
|
Species 3 |
C |
A |
C |
T |
T |
T |
G |
G |
A |
T |
G |
T |
A |
G |
C |
A |
G |
G |
T |
T |
T |
|
Species 4 |
G |
T |
T |
T |
C |
A |
G |
A |
A |
C |
T |
T |
G |
G |
T |
G |
C |
T |
A |
T |
C |
|
Ancestral Sequence |
C |
A |
C |
T |
T |
T |
G |
G |
A |
A |
G |
T |
A |
G |
C |
A |
G |
G |
T |
T |
C |
- What is the total number of base pairs included in the sequence to be analyzed in Table 12.1?
- Count the number of nucleotides that are like the ancestral sequence, then enter the number in the numeration table for each species pair.
|
|
Ancestral |
Species 1 |
Species 2 |
Species 3 |
Species 4 |
|---|---|---|---|---|---|
|
Ancestral |
x |
|
|
|
|
|
Species 1 |
|
x |
|
|
|
|
Species 2 |
|
|
x |
|
|
|
Species 3 |
|
|
|
x |
|
|
Species 4 |
|
|
|
|
x |
- Develop a phylogenetic tree hypothesis based on the relationships among these organisms and then draw it in your lab report.
- How many of the total number of base pairs do not align with the ancestral species?
- Species 1 ______
- Species 2 ______
- Species 3 ______
- Species 4 ______
- Convert the number of noncomplementary pairs into a percentage of the total base pairs. This is called the sequence divergence. Write the sequence divergence from the ancestral sequence for each species below.
- Species 1 ______
- Species 2 ______
- Species 3 ______
- Species 4 ______
- Place the species in order from most to least homologous compared to the ancestral species.

- Based on the evidence, which species is most closely related to the ancestral species?
- Describe how DNA sequence divergence provides scientists with information about relatedness.
- Fill in the phylogenetic tree in Figure 12.2 with species 1 through 4 to summarize the relatedness of the organisms that supplied the samples.
Part 3. Compare Cytochrome c amino acid sequence using the NCBI database
In this part of the exercise, you will use the Basic Local Alignment Search Tool (BLAST) and the Constraint-based Multiple Alignment Tool (COBALT) to compare a highly conserved gene/amino acid sequence among eukaryotes across tuna, the California grey whale, fruit fly, rhesus monkey, chicken, pig, yeast, and human. You will analyze the differences in these sequences to infer evolutionary relationships among the species in the group.
In this analysis, you will use the Cytochrome c (CYC or CYCS) amino acid sequence. The Cytochrome c gene encodes a protein that plays a key role during cellular respiration and apoptosis. Cytochrome c oxidase helps transfer electrons during cellular respiration, accumulating stored energy along the way to be spent later generating ATP. During apoptosis, cytochrome c oxidase accelerates cell death through the activation of cell-destroying enzymes. This gene is highly conserved across eukaryotes due to its contribution to supporting energy metabolism and body maintenance, processes essential to survival.
Highly conserved genes are ideal for studying evolutionary relationships because they have functional importance across diverse taxa and have not changed much over billions of years, making them reliable markers for evolutionary analyses. Over time, mutations that have appeared in the cytochrome c gene do not affect the function of the cytochrome c protein. Any mutations that have been sustained are called neutral mutations because they do not alter protein function. The examination of neutral mutations allows scientists to predict when organisms diverged from a common ancestor and from each other.
Materials
- Internet-connected computers or tablets
- A prepared protein sequence in FASTA format (e.g., PXXXXX) for the species you want to compare (in this case, we will use Cytochrome c [CYC or CYCS])
- Access to the protein sequence database
- Access to the NCBI BLAST tool
- Access to the NCBI Constraint-based Multiple Alignment Tool (COBALT)
Protein sequence FASTA sequences for Cytochrome c (CYCS or CYC)
- California gray whale (Eschrichtius robustus): P68100 (105 AA)
- Human (Homo sapiens): P99999 (105 AA)
- Tuna (Thunnus alalunga): P81459 (103 AA)
- Rhesus monkey (Macaca mulatta): P00002 (105 AA)
- Chicken (Gallus gallus): P67881 (105 AA)
- Pig (Sus scrofa): P62895 (105 AA)
- Yeast (Saccharomyces cerevisiae): P00044 (109 AA)
- Fruit fly (Drosophila melanogaster): P04657 (105 AA)
|
Cytochrome c (CYCS or CYC) |
|||
|
Common name |
Latin name |
FASTA Code |
Sequence Length |
|---|---|---|---|
|
California gray whale |
Eschrichtius robustus |
P68100 |
105 AA |
|
Human |
Homo sapiens |
P99999 |
105 AA |
|
Tuna |
Thunnus alalunga |
P81459 |
103 AA |
|
Rhesus monkey |
Macaca mulatta |
P00002 |
105 AA |
|
Chicken |
Gallus gallus |
P67881 |
105 AA |
|
Pig |
Sus scrofa |
P62895 |
105 AA |
|
Yeast |
Saccharomyces cerevisiae |
P00044 |
109 AA |
|
Fruit fly |
Drosophila melanogaster |
P04657 |
105 AA |
Procedure
- Navigate to the NCBI BLAST page.
- Choose Protein BLAST.
- Place a check in the “Align two or more sequences” box. A new box titled “enter subject sequence” will appear.
- Copy and paste the query FASTA sequence into the box (humans).
- Copy and paste the subject FASTA sequences into the box (all others), leaving all other default settings in place.
- Next to the database option under the choose search set section, select “non-redundant protein sequences” (nr) using the drop-down menu.
- Click BLAST button to perform the search.
- Review the BLAST results, focusing on the max score, percent identity, alignment score, and E-value. Record the percent identity, alignment score, and E-value for each species in part 3 of the response form. The max score represents how well the sequences match. The E-value represents the statistical significance.
- Compare the percent identity values for all species to the human query sequence, rank the species from most to least like humans, and develop a proposed phylogenetic tree based on this data. Answer questions 1-3 in part 3 of the response form.
- Visit the COBALT website to perform a species alignment.
- Enter all 8 FASTA sequences into the query sequence search box: P99999, P81459, P68100, P00002, P67881, P62895, P00044, P04657.
- Click Align to create the alignment.
- Answer the questions 4-7 in part 3 of the response form.
- Using the data presented in the alignment table, complete Table 12.4 in part 3 of the response form by writing down the number of differences between the cytochrome c amino acid sequence in a human and each of the indicated species. After completing the table, answer questions 8-11 in part 3 of the response form.
|
Species common name |
# of mutated amino acids compared to human |
|---|---|
|
Whale |
|
|
Rhesus monkey |
|
|
Chicken |
|
|
Pig |
|
|
Yeast |
|
|
Fly |
|
|
Tuna |
|
- Click “Phylogenetic Tree” in the left corner of the COBALT page to check the accuracy of your hypothesis.
- Paste a screenshot of the COBALT phylogenetic to question 12 in part 3 of the response form. Highlight or circle all the mammals in the phylogenetic tree produced by COBALT. Answer questions 13-18 in part 3 of the response form.
- Explore 2 additional genes/proteins from the list below to confirm findings, or perform your own unique phylogenetic analysis of 4-5 taxa you find interesting. Use COBALT to create a phylogenetic tree and post it to the discussion board. You can obtain your amino acid sequences by entering the acronym for the sequence + species name of the species you want to compare (e.g., “COX1 Mus musculus”) from www.uniprot.org.
-
- Cytochrome c oxidase I (COX1): A key enzyme that facilitates the transfer of electrons and protons to generate ATP in the mitochondria during aerobic cellular respiration.
- 16S Ribosomal RNA (16S rRNA): A component of the small subunit of prokaryotic ribosomes widely used in phylogenetics to study bacterial evolution and in metagenomics for identifying microbial species.
- ATP Synthase Subunit 6 (ATP6): Encodes a component of the mitochondrial ATP synthase complex, which produces ATP. Found in the mitochondrial genome and conserved across many species.
- NADH Dehydrogenase Subunit 1 (ND1): Part of the mitochondrial NADH: ubiquinone oxidoreductase complex (Complex I).
- Elongation Factor 1-alpha (EF1α): Encodes a protein involved in the elongation phase of translation. It is highly conserved across eukaryotic species, commonly used for molecular phylogenetics in plants, fungi, and animals.
Alternate Procedure for Online Courses
Complete a phylogenetic analysis of any two gene/protein sequences.
Appendix: How to interpret BLAST data
- Raw Score: The initial alignment score based on nucleotides of amino acids that match (match rewards) compared to the number that do not match (match penalties).
- Max Score: The highest alignment score in a BLAST search. It shows how well a part of the query matches part of the subject. A higher score means a better match. If the Max Score and Total Score are the same, it usually means the two sequences align well overall, without big gaps or differences.
- Total Score: The sum of all good matches between two sequences in a BLAST search. If there are several matching parts, their scores are added up. A higher score means more or better matches. This score works best when the sequences are about the same length. If they’re very different in size, the score doesn’t tell you as much.
- E-value: The probability of the alignment (overlap) is due to chance. The lower the E-value, the better, because this means the overlap is not random. E-value is not dependent upon comparing sequences that are the same length. E-value is a more reliable indicator than raw score.
- Percent Identity: Indicates the amount of genetic divergence between two sequences. The more similar the sequences, the more likely they perform the same function. Any percent identity below 50% represents a distant relationship.
References
Adams, J. (2020). Investigations in the Biology Laboratory. Stipes Publishing. Champaign, Illinois.
Hanson D. 2012. POGIL activities for AP biology. Batavia (IL): Flinn Scientific.
