15 Soil Ecology
Download this lab as a Microsoft Word document.
Download the lab response form (Microsoft Word document) to access the questions only.
Purpose
To examine the soil properties that support and sustain life.
Learning Objectives
At the conclusion of this exercise, students will be able to:
- Perform a seed germination assay.
- Investigate seed germination rate under varying environmental conditions.
- Measure the salinity and pH of soils.
- Analyze soil texture.
Why It’s Relevant
Soil forms the foundation for life on land, supporting the growth of plants and the ecosystems that depend on them. Human activities—such as pollution, deforestation, and industrial agriculture—can degrade soil by reducing its nutrient content and harming the diverse organisms that live within it. Healthy soils are essential to human well-being: they sustain agriculture to feed the global population, provide stable ground for buildings and infrastructure, and support biodiverse environments that offer both ecological value and recreational opportunities.
Introduction
Soil is a nourishing matrix of inorganic and biological matter. Soil is composed of minerals (inorganic nutrients from rock), living organisms, gas, water, and soil organic (biological) matter. It is the medium through which nutrients cycle between the living and non-living components of our world. Each component contributes to soil’s ability to support life. Minerals arise from the underlying parent material called bedrock. As rock is broken down to smaller sizes, the grainy texture of soil is formed.
The size of the mineral particles that make up soil can have a major impact on gas exchange and the ease with which plants can extract water and nutrients. Ideal soils are described as being loamy, which means there is an even combination of mineral particle sizes forming the matrix. Loam is ideal for plant growth because its composition consists of large sand, intermediate silt, and small clay-sized mineral particles. As a result, loamy soils hold water and nutrients well and have good infiltration. While particle size is important, it is not the only factor that influences soil quality. Biological material, both living and in various stages of decay, plays a critical role in creating healthy soil.
Living organisms like earthworms move through the soil, creating pores for improved drainage and the establishment of plant roots. They also feed on organic material and leave behind waste that enhances the absorbability of nutrients from the soil by plants. The organic layer of soil consists of the remains of living organisms in various stages of decay, along with specialized microorganisms that break them down. Healthy soils promote plant growth, which supports a diverse assemblage of species at multiple trophic levels. In addition to supporting biodiversity, good quality soils support agriculture, which has allowed the human population to grow worldwide
Unfortunately, agriculture and other human activities have greatly diminished soil quality over the years. The application of road salt, the burning of fossil fuels, and waste disposal are just a few of the human activities that pose a challenge to soil health.
Chemical factors that make soil less desirable for supporting life are collectively called soil pollution. Soil pollution may change chemical characteristics such as pH or salinity, and add harmful contaminants or remove essential elements. Physical characteristics of soil may also be impacted by human disturbance. Species removal increases the likelihood of soil erosion by eliminating plant roots that help keep soil intact. Soil erosion can lead to the loss of finer particles, altering the overall texture and properties, including its ability to retain water and nutrients.
Whether collectively or individually, chemical and physical alternation of soil can negatively impact plants’ ability to establish themselves, and by extension, reduce the soil’s capacity to support biodiversity.
In this lab, you will compare the soil characteristics at several different locations, then use a seed germination assay to assess soil quality. The measurement of seed germination rate as an indicator of soil health was adapted from an activity by Anderson (2019).
Safety consideration
Danger: Be sure to seek approval from the local utility company or get permission from the building and grounds department prior to digging up soil in any area!
Lab Overview
- Soil sample collection
- Soil texture analysis
- Part A: Investigating the effect of soil conductivity and pH on seed germination
- Part B: Investigating soil biology
- Alternate Procedure for Online Courses: Investigating the effect of pollutants on seed germination
Soil sample collection
Comprehensive soil analysis involves examining its physical, chemical, and biological properties. Throughout this lab, you will analyze each of these characteristics and perform a seed germination assay to help assess overall soil health.
After obtaining a map of safe places to dig, identify land areas you think might have interesting soil ecosystems to investigate. Your instructor might advise you to use a randomized approach to select specific areas to obtain your samples. Randomization is an important strategy used to eliminate bias from data collection. There are several approaches to collecting randomized data, one of which involves the use of a random number generator. Once each site has been identified, use a trowel to remove the top 5 centimeters of soil. Gather a whole plastic sandwich bag full of soil so that you have enough for physical and chemical analysis. Place your soil in the plastic sandwich bag and label each bag with the site location, your group name, and the date. Record any details about the environment surrounding each site by inserting a comment to the spreadsheet you plan to use to document data. Consider land use, plant species composition, and the level of soil moisture in your notes. Return to the lab with your soil samples. The amount of soil collected can be divided for use in all of the procedures that follow.
Physical texture of soil
Before analyzing the chemical and biological characteristics of your soil sample, you will analyze the physical texture of soil. Soil texture is formed by combining varying sized rock particles that result from the weathering of parent material. Soil particles are generally divided by size with sand as the largest, silt as intermediate, and clay as the smallest particle. The relative proportion of sand, silt, and clay affects the appearance and feel of the soil. It also affects the amount of water tension and pore space in the soil. The amount of water and air able to be trapped in the soil influences percolation and aeration, which are important to plant and animal life. Soil texture can be measured using a simple method called a jar test, which allows you to determine the percentage of sand, silt, and clay in your sample.
Materials
Safety Warning: This lab utilizes hazardous materials. Be sure to follow your instructor’s direction on wearing proper personal protective equipment and disposal procedures. The Biology Department Laboratory Safety Practices must be followed.
- Beaker or jar
- Permanent marker
- Ruler
- Cheese cloth or mesh
Procedure
- Use a mesh sieve to remove debris like rocks, sticks, and roots from the sample. This ensures you’re only testing fine soil particles.
- Fill the jar with soil until it is about ⅓ full.
- Fill the remainder of the jar with clean tap water, leaving some space at the top for shaking.
- Secure the lid tightly and shake the jar vigorously until the soil is fully mixed and forms a uniform slurry (no clumps).
- Place the jar on a level surface and let it sit for 1 minute, then mark the top of the settled sand layer on the outside of the jar. Sand settles first because it is the heaviest.
- Leave the jar undisturbed for 2 hours, then mark the top of the silt layer that settles on top of the sand.
- Keep the jar undisturbed for another 48 hours to allow the clay to settle, then mark the top of the clay layer, which is the finest and lightest material floating on top of the silt layer.
- Use a ruler to measure the height of the sand, silt, and clay layers, as well as the total height of all three layers combined. Record your data in Table 15.1 on the response form.
- Calculate the percentage of each soil particle size by dividing the height of each layer by the total height, then enter the data into Table 15.1 on the response form.
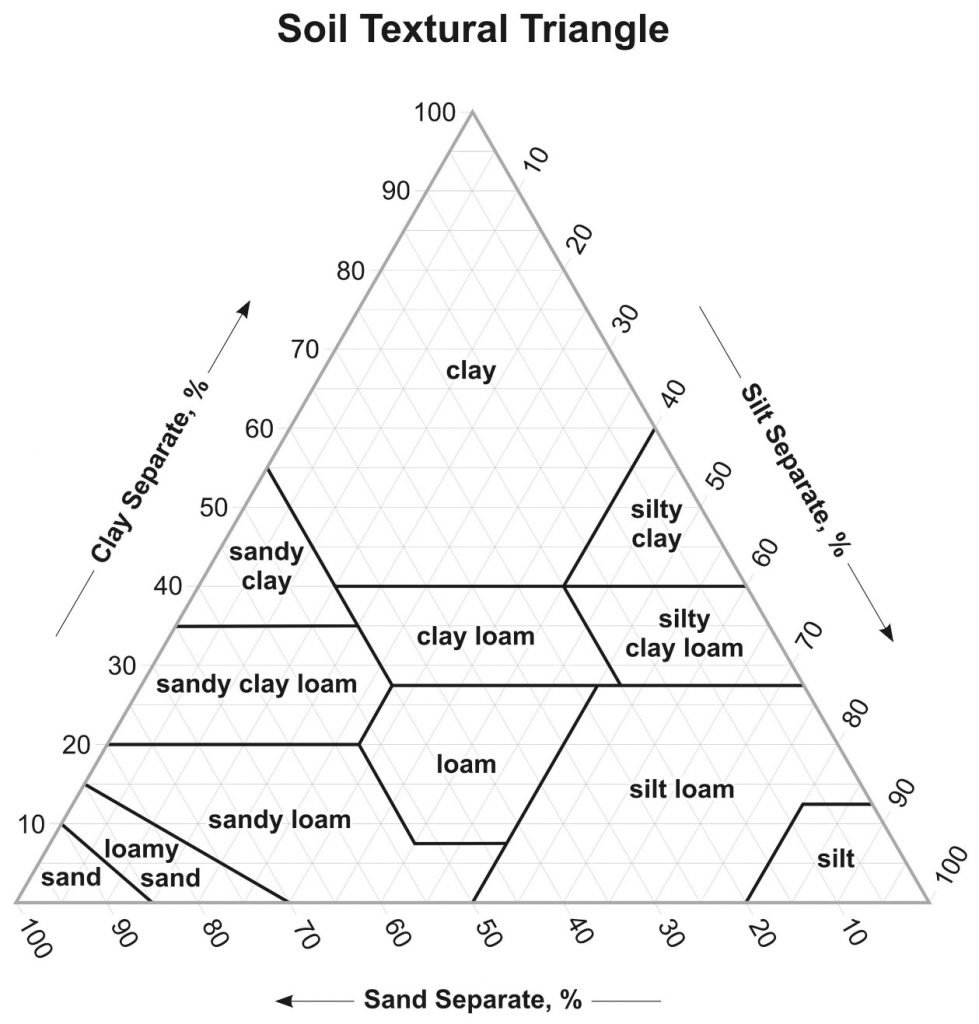
Determining Soil Type with the Soil Texture Triangle
Use the Soil Texture Triangle (Figure 15.1) to identify soil type:
- Find the percentage of clay you calculated on the left border of the triangle and draw a horizontal line from left to right until you reach the opposite border of the triangle.
- Find the percentage of silt you calculated on the right border of the triangle and draw a downward diagonal line from right to left until it reaches the opposite border of the triangle.
- Find the percentage of sand you calculated on the bottom border of the triangle, then draw a line upward and to the left until it reaches the opposite border of the triangle.
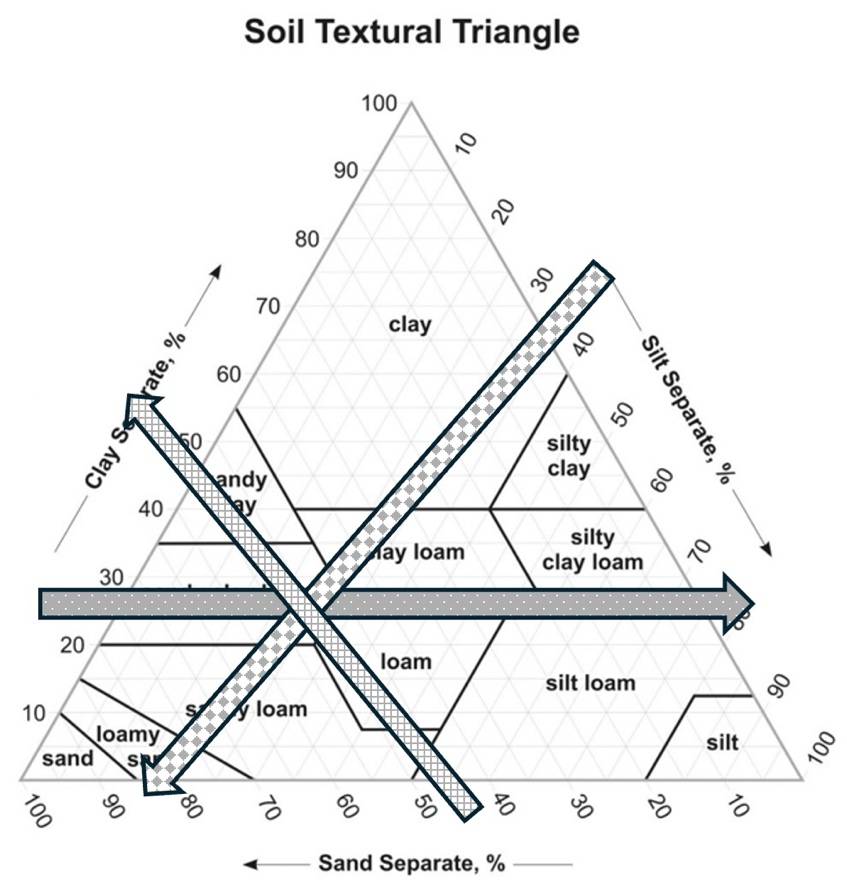
- Identify the point where all three lines intersect to determine the soil type (e.g., silty loam, sand, silty clay, etc.). See Figure 15.2 for an example. Answer questions 1-4 on the response form.
| Measurements | Value (cm) |
|---|---|
|
Height of sand layer |
|
|
Height of silt layer |
|
|
Height of clay layer |
|
|
Total height of layers |
|
|
% Sand |
(sand height / total height) × 100 = |
|
% Silt |
(silt height / total height) × 100 = |
|
% Clay |
(clay height / total height) × 100 = |
Questions
- Using the soil texture triangle, identify the soil type with the greatest soil retention ability and water percolation rate.
- Identify the texture of your soil sample.
- What inferences can you make about how plants will grow in each soil sample you collected?
- Some neighbors get angry when people walk on their lawn, and businesses sometimes discourage people from walking in areas that are not a designated path. What are some reasons people might discourage people from trampling their turf?
Part A. Investigating the relationship between natural soil salinity/conductivity and pH and seed germination rate
Purpose
To compare the seed germination rate of seeds in a solution made from local soils. Students will measure the conductivity and pH of soil samples using the slurry method, then measure the rate of seed germination from an extract made from these soils. Conductivity measures the ability of water to conduct an electric current, which is influenced by the presence of dissolved salts and inorganic materials. It serves as an important indicator of soil quality, as significant changes in conductivity can signal pollution.
Question
Do the chemical properties of soil affect seed germination rate?
Develop a Hypothesis
Hypothesis:
Materials
- Garden trowel
- Conductivity probe
- pH probe or pH test strips
- Radish seeds or similar
- Small petri dishes
- Ruler
- Beaker
Procedure
- Place 150 grams of soil from three different study sites into three separate beakers. Label your samples with the location where they were extracted.
- Prepare a control by measuring 50 grams of non-fertilizer potting soil and place it into a beaker labeled “control group.”
- Using part A of the lab response form, record a prediction indicating which soil sample you believe will have the highest germination rate and rank the samples from best to worst using the observations you documented about the areas where the samples were collected.
- To analyze your soil samples, you will need to prepare a soil slurry. Mix 50 grams of soil with 100 mL of water. You may amend these volumes to suit your needs by ensuring your ratio is two parts distilled water to one part soil.
- Mix thoroughly and allow the solution to sit for a minimum of 15 minutes. The longer your sample sits, the more accurately the aqueous solution will reflect the chemical characteristics of the soil. For best results, allow the slurry to sit overnight.
- Once the designated time has elapsed, stir again and measure the pH and conductivity (salt) of each soil slurry sample using the appropriate probes. Document your findings in Table 15.2 on part A of the response form.
- Record a second prediction about the expected rate of radish seed germination based on the data collected and organized in Table 15.2.
- Decant the four liquid soil samples into separate beakers, using cheesecloth to prohibit passage of particulate matter.
- Place the aqueous soil samples from each site and the control into separate containers so that you have triplicates (three copies for each site).
- Line the bottoms of 12 clear Petri dishes with three layers of paper towels cut to the size of the lids. You should have three replicates for each solution, including your control, and each experimental site. Be sure to label each container with the appropriate treatment and replicate number.
- Scatter ten seeds on top of the paper towels in each container.
- Saturate the paper towels in each lid with 10 mL of solution (or enough to keep the paper towel moist over a 5–7-day period). The amount of solution used in each lid should be consistent across all treatments. Placing the lids in a resealable plastic bag helps maintain moisture.
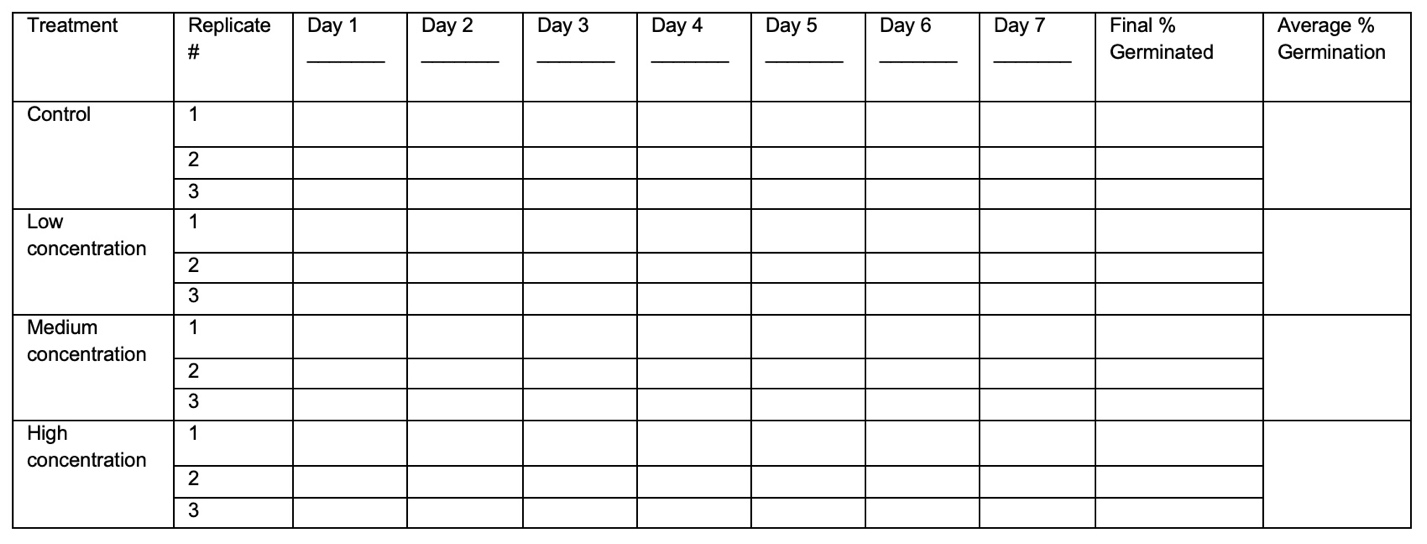
- Record the number of seeds that germinated in each replicate over a 7-day period using Table 15.4 on the response form.
- Calculate your final % germinated by using the total number of seeds germinated by the last day of your observations.
- Calculate the average of the three replicates for each treatment.
- Graph the average percent germination data. You should have four bars, including the control and three experimental sites. The Y-axis should reflect the average percent germinated and the X-axis should reflect your experimental sites.
- Correlate your conductivity and pH data to the rate of seed germination in each treatment and the control, then answer question 6 of part A of the response form.
|
Soil Sample |
pH |
Conductivity (mS/cm) |
|---|---|---|
|
Sample 1 |
|
|
|
Sample 2 |
|
|
|
Sample 3 |
|
|
|
Control |
|
|
Part B. Investigating Soil Biology
Where water supports life in aquatic environments, soil serves as the medium for life on land. Healthy soil has millions of species and billions of organisms that represent the greatest concentration of biomass anywhere on the planet (USDA, 2023). You may find microbes, arthropods, insects, worms, and even small mammals living in soil. Soil organisms play an important functional role in promoting soil fertility. Measuring soil biodiversity can reveal clues about soil health.
In this section you will utilize a Berlese-Tullgren funnel to drive invertebrates into the bottom of the funnel, where they fall into alcohol preservative.
This lab utilizes hazardous materials. Be sure to follow your instructor’s direction on wearing proper personal protective equipment and disposal procedures. The Biology Department Laboratory Safety Practices must be followed.
Materials
- Ring stand or other method to suspend the bottle
- Funnel or an empty clear soda bottle
- A 200 mL beaker or empty mason jar
- ¼ inch mesh hardware cloth
- Scissors
- Tape (clear or duct)
- 70 % ethanol or rubbing alcohol
- Lamp with 60 W bulb
- Transfer pipette or small paintbrush
- Clear nail polish
- Forceps
Procedure
- Cut the bottom off a liter-sized soda bottle or gallon milk jug and place it upside down over a jar to create a funnel. Alternatively, use a regular funnel.
- Fold down the corners of a 10 cm by 10 cm cut section of mesh so it fits securely inside the wide end of the funnel. Alternatively, you might use window screening. If so, cut multiple slits to allow larger organisms to crawl through.
- Weigh 100 grams of soil from the remainder of your samples and place it on top of the wire mesh. Note that the soil you place in the funnel taken from each site should ideally be from the same soil horizon.
- Pour alcohol into the jar or cup to a depth of 1–2 cm.
- Carefully set the funnel on top of the ring so that it hovers over the jar.
- Position a lamp approximately 10 cm above the funnel to speed up the drying process.
- Leave the setup in a warm, undisturbed location for 24–48 hours, maximum.
- Extract specimens from the alcohol carefully using a pipette or small paintbrush.
- Preserve specimens on a glass slide or petri dish by applying a thin layer of clear nail polish on the surface and placing the specimen onto the polish using the brush while it is still wet.
- Once the specimen is positioned, apply another thin layer of nail polish over the specimen to seal it.
- Allow the specimen to fully dry.
- Observe specimens using a dissecting microscope. Try to place specimens in categories based on their appearance.
- Compute the Shannon Wiener biodiversity index by completing Table 15.3 to compare species richness and evenness present at each site, then answer questions 1-4 on part B of the response form. The Shannon Wiener diversity index calculates a value based on species richness (number of species) and evenness (relative abundance).
The Shannon-Wiener Index (H) considers both the number of species and the evenness of the distribution of individuals among those species (relative abundance). It reflects the level of uncertainty in predicting the species of an individual selected at random from the community. In other words, the higher the diversity, the less likely you are to correctly predict the species of the next individual chosen at random. The value of H ranges from 0 (for a community with only one species) to over 7 (for a highly diverse community).
Shannon Wiener Index formula: H = – ∑ (Pi ln Pi)
Where Pi (relative abundance) = ni /N
Ln = natural log
ni = number of individuals in species i
N = total number of individuals in all species
Calculate Shannon Wiener Index by following these steps and completing Table 15.3:
- Write a species identifier name in column 1 and its frequency in column 2.
- Calculate the proportions by dividing the frequency of each species by the total number of individuals. Place this value, Pi, in column 3.
- Calculate the natural log of the proportions (ln*Pi) and write the values in column 4.
- Multiply the proportions by the natural log of the proportions (column 3 * column 4). Write this value in column 5. This is your Pi * ln (Pi).
- Calculate the Shannon Wiener Diversity Index (H) by taking the sum of column 5.
- Write the calculated value for H on the answer sheet.
|
Column 1 |
Column 2 |
Column 3 |
Column 4 |
Column 5 |
|
Species |
Frequency |
pi |
Ln (pi) |
pi * ln (pi) |
|---|---|---|---|---|
|
|
|
|
|
|
|
|
|
|
|
|
|
|
|
|
|
|
|
|
|
|
|
|
|
|
|
|
|
|
|
|
|
|
|
|
|
|
|
|
|
H = |
Questions
- Compare the communities of organisms found at each site sampled. How do they differ in abundance and diversity?
- What conclusions would you draw about the amount of nutrients in the soil samples, based upon the relative abundance of biota found there?
- How might the composition of biodiversity affect the rate of leaf and debris decomposition?
- There are many ways your experimental setup could have affected your results. Remember, most of these invertebrates are small with limited mobility. What might you have found if you instead used a smaller amount of soil? A different watt lightbulb? How could you redesign your apparatus to collect a less biased sample?
Alternate Procedure for Online Courses: Investigating the effect of salinity, pH, and lipids on radish seed germination.
Purpose
To compare the seed germination rate of radish seeds exposed to low, medium, and high levels of pollutants (salt, pH, and oil). To investigate the effect of soil pollutants on the rate of radish seed germination.
Materials
- Condiment cup lids or jar lids or shallow Petri plate (visit College of DuPage to obtain screw cap vial lids for organisms’ jars)
- Plastic wrap
- Paper towels
- Radish seeds or similar
- Salt NaCl 0%,1%, 5%, 10%
- Vegetable oil 0%, 5%, 10%, 15%
- pH control 8, and treatments 4, 5, and 6
- Vinegar
- Baking soda
- Distilled water
Procedure
- Select one of the following environmental pollutants to investigate: salt or vegetable oil. You may also investigate pH by adjusting the acidity and alkalinity using a dilution of baking soda (or alkaline water) or vinegar in water (acidic). If you investigate pH, you will need to verify the actual pH of your solution using a test kit. Test kits for pH can be found at hardware and pet stores.
- Develop a hypothesis regarding the effect of your treatment on the rate of seed germination, then record it on the alternate procedure section of the response form.
- If testing salt, prepare 30 mL of a 1%, 5%, and 10% weight by volume solution using the following equation: % w/v = X g of salt / 100 mL of solution.
- If testing oil, prepare 30 mL of a 5 %, 10%, and 15% volume by volume solution using the following equation: % v/v = X mL of vegetable oil / 100 mL of solution. Mix well to produce an emulsion.
- Line the bottom of 12 equal-sized clear or white container lids with three layers of paper towels cut to the size of the lids. You should have three replicates for each solution, including your control, low, medium, and high concentration of pollutant. Be sure to label each container with the appropriate treatment and replicate number.
- Scatter ten seeds on top of the paper towels in each container.
- Saturate the paper towels in each lid with 10 mL of solution (or enough to keep the paper towel moist over a 5–7-day period). The amount of solution used in each lid should be consistent across all treatments. You should have 4 lids with 0% pollutant (control), low, medium, and high percentages of pollutant.
- Cover the lids with seeds inside with clear plastic wrap or place them in a resealable plastic bag.
- Record the number of seeds that germinated in each replicate over a minimum of 5 days and a maximum of 7 days and enter your data into Table 15.4.
- Calculate your final % germinated by using the total number of seeds germinated by the last day of your observations in each lid.
- Take the average of the three replicates for each treatment.
- Graph the average percent germination data, then answer the questions on the alternate procedure section of the response form. You should have four bars including the control, low, medium, and high concentrations of pollutant. What is the dependent variable? What is the independent variable? Hint: The Y-axis should reflect the average percent germinated and the X-axis should reflect the specific percentage of pollutant treatments.
Questions
- Identify the independent variable in this study.
- What was your total sample size?
- Did you reject or fail to reject your hypothesis?
- Reflect on the effect of the type of pollution you investigated on seed germination rate. What is the real-world application?
- Name one factor that could lead to errors in your dataset.
- The optimum soil pH range for most plants is 6.0 to 7.0. What inference can you make about the quality of soil you collected in your sample based on the pH measured?
- Why is pH an important aspect of soil fertility?
- Nitrogen pollution from burning fossil fuels causes excess nitrogen deposition into soils in the form of HNO3. What is the potential impact of HNO3 deposition in soils?
- Consider the impact of lawncare services that enhance the soil with products that change its pH, conductivity, or other parameters. Select one and discuss the potential impact it has on soil ecology.
References
Anderson, B.J. (2019). Survey of Biology 1100 Laboratory Guide. 8.1 ed. Stipes Publishing. Champaign, Il.
K-State Libraries. [date unknown]. Soil texture and structure. In: Soils lab manual. Manhattan (KS): Kansas State University Libraries. [accessed 2025 May 2]. https://kstatelibraries.pressbooks.pub/soilslabmanual/chapter/soil-texture-and-structure/
