2 Module 2: How Psychologists Know What They Know
A major goal of Module 2 is showing you some details about how psychologists use research to expand their knowledge of human behavior and thinking processes. This module explains many of the nuts-and-bolts methods of conducting psychological research. As you read about psychological phenomena throughout the book, keep in mind that the research was conducted using one of these methods, sometimes a very sophisticated version.
Module 2 is divided into five sections. A section that presents the overall process of research is followed by two sections that describe the characteristics, strengths, and limitations of the major research methods in psychology. One is about the types of scientific studies that are used to describe people and determine relationships among phenomena (case studies, surveys, and naturalistic observations); the other describes in some detail the most important type of research in psychology, the experiment, which allows us to determine cause-and-effect relationships. Another section explains the use of statistical procedures to summarize and draw conclusions about research. The module would not be complete without a discussion of why ethics are important in psychological research and how to conduct research ethically.
- 2.1 The Process of Psychological Research
- 2.2 Research Methods Used to Describe People and Determine Relationships
- 2.3 Research Methods Used to Determine Cause and Effect
- 2.4 Statistical Procedures to Make Research Data More Meaningful
- 2.6 Ethics in Research
READING WITH A PURPOSE
Remember and Understand
By reading and studying Module 2, you should be able to remember and describe:
- Three elements in psychological research: observations, theory, hypothesis (2.1)
- Characteristics, strengths, and limitations of descriptive and correlational research methods: case studies, surveys, naturalistic observation (2.2)
- Variables, correlations, correlation coefficient (2.2)
- Reasons that correlations do not imply causation (2.2)
- Experimental method: independent and dependent variables, experimental and control groups, random assignment, extraneous variables (2.3)
- Descriptive statistics: frequency distributions, measures of central tendency, measures of variability (2.4)
- Inferential statistics (2.4)
- Two basic approaches to deciding whether a research project is ethical (2.5)
- American Psychological Association ethical guidelines for research (2.5)
Apply
By reading and thinking about how the concepts in Module 2 apply to real life, you should be able to:
- Design and conduct a simple survey project (2.2)
- Design and conduct a simple experiment (2.2)
Analyze, Evaluate, and Create
By reading and thinking about Module 2, participating in classroom activities, and completing out-of-class assignments, you should be able to:
Formulate hypotheses from scientific theories (2.1)
- Select an appropriate research design from a set of research goals (2.2 and 2.3)
- Explain why the conclusions drawn about a research project are warranted or unwarranted (2.2 and 2.3)
- Identify the research method and key elements of the method from a description of a research project (2.2 and 2.3)
- Explain why a researcher’s choice of descriptive statistics is appropriate or inappropriate (2.4)
- Judge whether a research project is likely to be considered ethical or unethical using the basic ethical approaches and the American Psychological Association ethical guidelines (2.5)
2.1 The Process of Psychological Research
Activate
- Do you generally trust or mistrust science and research? Why?
Research is essential to science, and so it is (or should be) conducted very carefully. You will be able to recognize the basic ideas behind scientific research, however, because chances are that you have often conducted an informal kind of research.
The process often starts with some observations of a curious phenomenon. You see or hear or learn in some other way that something noteworthy is happening. For example:
Several years ago, while Piotr and his fiancee Zofia were driving around and looking for a place to eat dinner, she glanced up at a billboard and read, “Joe’s Pizza.” It was, however, a sign for a car dealership owned by a man named Joe Rizza.
Once, about halfway through eating what he thought was a raisin bagel, Piotr realized that it was actually a chocolate chip bagel with no raisins at all.
Try as he might, Piotr couldn’t decipher the lyrics of a song he liked. But after he read them somewhere, he could hear them clearly.
For people with an inquiring mind, the next step is to try to answer the question “Why did that happen?” A scientist uses theories to fulfill that goal; one of the primary roles of theories is to explain observations. We also come up with informal theories (explanations) in everyday life:
- Because she was hungry, Zofia misperceived the car billboard to be consistent with what was on her mind at the time, namely food.
- Because he expected the bagel to have raisins in it, Piotr mistakenly thought that the chocolate chips were raisins.
- Seeing the words of the song written down somehow put him in a frame of mind to hear them more clearly.
The second primary role of a theory is to organize different observations. In essence, scientists use theories to propose common explanations for or important relationships between different observations. In everyday life we also may have an insight about how different phenomena are related. In each of the everyday examples we provided here, a person’s perception of some stimulus (billboard, taste of bagel, song lyrics) is influenced by the state of mind that he or she is in at the time (being hungry, expecting raisins, knowing what the lyrics are from reading them). This last statement is basically a theory about perception. For now, let’s call it a theory of expectation effects in perception: If people have an expectation, they are likely to perceive some stimulus in a way that is consistent with that expectation. (sec 11.3) Please note, however, that although scientists may get their ideas for research from everyday observations, such as the examples we have been using here, they will use much more carefully controlled observations obtained during research to formulate or refine a theory.
Theories have one last important role: they allow us to make predictions about future observations. These predictions are called hypotheses, and they are used to test the theory. For example, from our theory about expectation effects, you might predict that many other kinds of perceptions would be similarly affected. This might be one hypothesis derived from the theory: Fearfulness may set up an expectation that causes a shadow on the wall to be mistakenly perceived as an intruder. If the hypothesis is verified by a well-designed research study, the theory becomes more believable. If the hypothesis is not verified, the theory may need to be modified to fit the new observation; in extreme cases a hypothesis that is not verified can lead to a rejection of the theory.
So, to summarize, a theory is a set of statements that explain and organize separate observations and allow a researcher to make predictions, or hypotheses, about some possible future observations. Although the process may seem simple, scientific research is really a complex interplay among observations, hypotheses, and theories.
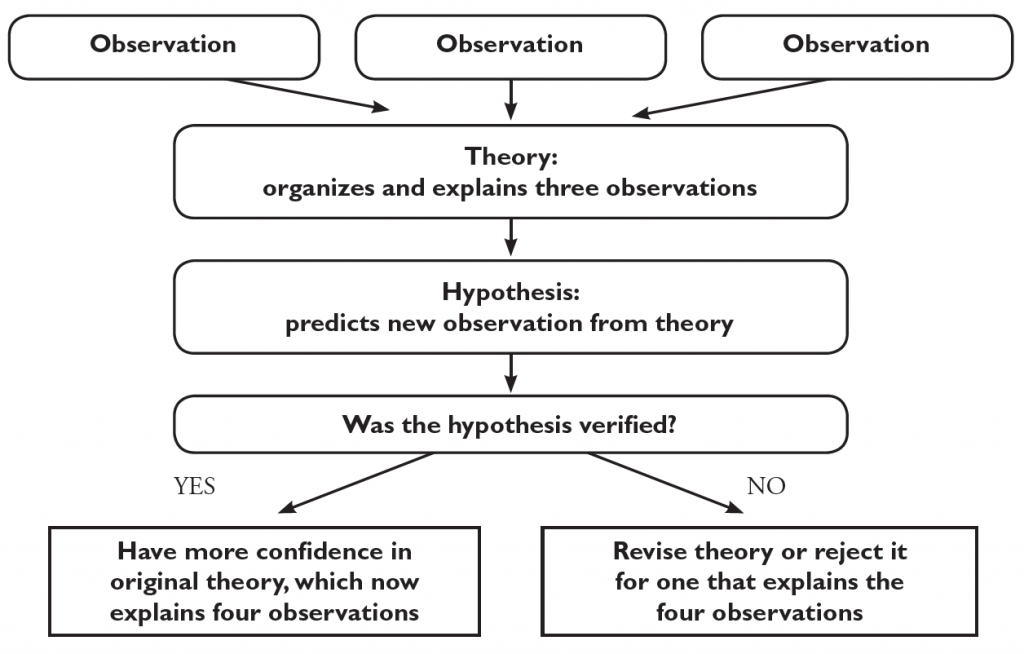
Finally, a scientist need not begin the process with observations. This is particularly true for a beginning researcher, who as a graduate or undergraduate student is generally considered an apprentice. Students often begin the research process by learning about theories, often reading about them in scientific journals. Then they can generate new hypotheses from the theory and continue the process from there.
hypothesis: A prediction that is generated from a theory.
Debrief
- In the introduction to this unit, we listed some questions—essentially some observations—about human behavior and mental processes (see the “Have you ever wondered?” section). Please turn to the introduction and select two observations. For each question:
- Try to come up with a statement that explains why the type of event from the observation happens; this is your informal theory.
- From your theory, try to generate a hypothesis about a new observation.
2.2 Research Methods Used to Describe People and Determine Relationships
Activate
- Have you ever participated in a survey? What do you think the researcher was trying to discover?
- Have you ever been a subject of an observational study (that you are aware of)? What do you think a typical goal would be for a researcher who is observing people?
Research begins with a question. Driving home from work, you notice that solitary drivers seem to be driving faster than those with passengers, and you wonder if that is generally true, and if so, why? While trying to fall asleep, you decide to count sheep and discover that it does not help you fall asleep. You wonder, “Am I typical; is counting sheep to help sleep really a myth?” Or you notice that many of your classmates obviously enjoy school, whereas others barely endure it, and you wonder what makes some people dislike school. Many of the world’s greatest researchers are driven primarily by this kind of curiosity.
To answer their questions, researchers have many different specific research methods from which to choose; a researchers’ selection of a method will depend largely on their goals. If the goal is to describe people or determine whether different characteristics of people are related, the research method chosen will probably be a case study, survey, or naturalistic observation.
Case Studies
Let’s consider the research question of why some students dislike school. One way you might try to discover what makes people dislike school is to study in depth someone who happens to dislike it. You could interview him, his teachers, his parents, and his friends; you could observe him in school and at home; and you could study his school records. This technique is a research method known as a case study, a detailed examination of an individual person, or case. It is an excellent method for describing individuals, a reasonable goal of a research project. Psychologists use case studies, obviously, when they need to learn a great deal of information about one person.
There are many situations in which case studies are used. For example, psychologists and neuroscientists might conduct a case study on a patient who has suffered a brain injury to determine the types of mental abilities that have been compromised by the injury, as well as to suggest potential treatments or therapies that might be effective.
You might discover from a case study that our individual in question dislikes school because he had a horrible first grade teacher who used to humiliate him in front of the other students. As he grew older, he realized that he hated being told what to do, preferring to do things his own way. Making matters worse, he had a big problem with the focus on grades; he would have liked it better if he could just learn without being graded. As a result, his grades were very low, and he had to endure a lot of harassment from his parents and teachers. In their never-ending attempts to improve their son’s grades, his parents tried threatening severe punishments when he got bad grades and offering money for good grades.
Our example reveals both the strengths and limitations of case studies. When done carefully, a case study provides us with an extraordinary amount of information about our individual. Because it relies on many specific techniques, the case study is the best method to gather this information.
Ordinarily when we do research, however, we want to know about more than a single person. In short, we would like to be able to draw conclusions about a larger group of people. In this particular case, we would like to be able to say something about people who dislike school in general. Unfortunately, however, when we use the case study method, we cannot do that. When we examine a single case, we never know whether we have picked an unusual case. For example, it is likely that many students who dislike school never had the first grade teacher who humiliated students. Many other students dislike school even though they get good grades. In short, we have no idea how general our individual’s issues and experiences about school are. We need some kind of method that will allow us to draw conclusions about people in general.
Surveys
Perhaps if you asked a large group of people about their attitudes toward and experiences in school, you might be able to draw conclusions about people in general. For example, you could take the ideas generated from your case study and formulate them as questions to ask a large group of people: Did you ever have a teacher who humiliated you? Do you like or dislike being told what to do? And so on. This is the basic idea behind a survey: a researcher asks questions, and a group of participants respond.
There are very many details and options to be filled in, of course. For example, the questions may be asked in person, on paper, by telephone, or by computer. The questions may be open-ended, in which the participants are free to answer with any response they want, or closed-ended, in which a set of alternatives or a rating scale is provided for the participants.
Surveys serve a great many purposes for researchers. Generally, they are used to measure peoples’ attitudes, opinions, and behavior and to obtain demographic information (for example, gender, age, household income). Surveys’ greatest strength is efficiency. In order to draw conclusions about a group of people, it is not necessary to survey all of them. In fact, if a survey is done correctly, a very small sample of people within that group will suffice. For example, the Gallup Organization (one of the most well-respected survey companies) maintains a survey product called World Poll in which they represent 95% of the World’s population by surveying 1000 – 2000 respondents per country (for most countries).
There is one key limitation that is inherent to the survey method itself. People might lie. There is really no way around that. Researchers can insert questions designed to detect dishonesty in participants, but those questions can sometimes be pretty obvious. Two other problems with surveys are technically not limitations of the method, but they may just as well be because they are so common. Basically, people seem to misinterpret the simplicity of the basic survey concept to mean that surveys are simple to conduct. They are not. Researchers can fall into two major traps: They can ask the questions the wrong way, and they can ask the wrong people.
Question Wording.
Surveys are intended to measure relatively stable, sometimes permanent, characteristics of people. Unfortunately, however, people’s responses to survey questions can vary dramatically as a consequence of the way questions are worded. Biases due to question wording effects are quite common. Research has demonstrated their influence for many types of questions, including those measuring self-esteem (Dunbar et al. 2000), political party identification (Abramson and Ostrom, 1994), public support for a woman’s right to abortion (Adamek, 1994), and even respondents’ race (Kirnan, Bragge, and Brecher, 2001).
Question wording effects frequently occur without the researcher’s awareness of the problem. Even worse, if a researcher is dishonest, he or she can easily come up with biased questions to elicit a desired response.
Sampling.
In order to be able to draw conclusions about a large population from a relatively group of respondents, the sample used in a survey must be a representative sample of the population from which it is drawn—that is, it must resemble the population in all important respects. For example, if a population of college students has 25% each of freshmen, sophomores, juniors, and seniors, so should the sample. The simplest way to ensure a representative sample is to use random sampling, in which every member of the population has an equal chance of being a participant in the survey.
Getting a representative sample is easier said than done, however, and it is difficult to accomplish even when professional survey companies are conducting the research. A great deal of surveying is still done by phone, and people are increasingly screening their calls and rejecting ones from unrecognized numbers. One company (ZipWhip) recently reported that in their research (no word on if it was a representative sample), nearly 90% of consumers reported recently rejecting calls from unknown numbers. Although there is some research that suggests that caller ID information indicating a call is coming from a legitimate organization can increase response rates for some people (Callegaro, McCutcheon, & Ludwig, 2010), that still means that the sample might not be representative. Other difficulties commonly arise as well. Researchers often make several attempts to contact people who did not answer the first time a call was placed. Eventually, however, they will be forced to give up on some. Finally, just because the researcher gets the person on the phone it does not mean the survey will be completed. Many people decline to participate, often believing that the call is not a legitimate survey but a telemarketing call. The result is a sample that may very well be unrepresentative of the overall population. And this is when the survey is being conducted by a high-quality, honest, professional survey company.
What if the organization conducting the survey is not being so careful? As you might guess, it is very easy to create an unrepresentative sample. For example, instead of telephoning people randomly, a researcher can purchase from a list broker a list of phone numbers for people who subscribe to a particular magazine or donate to a particular cause. In many other cases, surveys are based on what are called convenience samples, groups of people who are easily available to the researcher. For example, the researcher can go to a train station and approach people waiting for the morning train. Although convenient, this sample should not be considered representative of the adult US population. At least the researcher is maintaining some control over the sampling process by approaching potential participants. If a researcher who is using a convenience sample is careful and exercises good judgment, the resulting sample can be representative. For example, the researcher can approach individuals in several different locations and at several different times to try to capture a more representative sample.
When researchers rely on self-selected samples, however, there is no confidence at all that the sample is representative. A self-selected sample is one for which the researcher makes no attempt to control who is in the sample; inclusion in the sample requires the effort of the participants only (the participants “self-select” into the sample rather than being specifically asked to participate). For example, a survey is published in a magazine and all readers are invited to respond. Typically, very few choose to do so; those who do respond usually are more interested than most people in the topic and usually have very strong and often extreme opinions (that is probably why they responded). The opinions of these few people are often unrepresentative of the opinions of the rest of the readers.
Biased samples are an extremely common and serious flaw in a great deal of survey research. Be very cautious about accepting the results of a survey unless you know that an effort was made to obtain a representative sample.
Naturalistic Observations
Suppose you conduct a survey of a representative sample of students at your school, and you discover that students who dislike school tend to report that their instructors have unfair grading policies, often evaluating students on work that they were not aware was required. Then, thinking there might be more to the phenomenon than the survey indicates, you decide to follow your representative sample throughout the semester. By hanging around with students before, between, and after classes, you discover that the students who reported that their instructors were unfair often skipped most of their classes, including the first day when the requirements were given to students. You have just discovered the advantage of our third research method, naturalistic observation, over surveys. The researcher simply observes behavior without interfering with it at all. The goal is to try to capture the behavior as it naturally occurs.
The greatest strength of naturalistic observation is that behavior does not lie. As we indicated above, people responding to surveys sometimes do (or even if they do not lie, they are sometimes mistaken). For example, one naturalistic observation found that users of a self-serve copy machine at a university underreported the number of copies that they made (Goldstone & Chin, 1993). Imagine if the researchers had conducted a survey instead, asking people if they always reported the correct number of copies on the copy machine. Many of the people they surveyed would deny ever misreporting the number of copies. Although there are some survey procedures that make it more likely that respondents will be honest, you can never be sure. With naturalistic observation, you can be sure; behavior does not lie.
On the other hand, although behavior does not lie, it can be difficult to interpret. This is probably the greatest limitation of naturalistic observation. It can be extremely difficult to make objective observations, especially when the behavior being scrutinized is complex. For example, asking observers to count the number of aggressive acts committed by a group of children is difficult. For one thing, what counts as an aggressive act? This is a realistic example of the challenge facing researchers trying to conduct a naturalistic observation.
Correlation Coefficients: Representing Relationships
So far, we have discussed one major goal of case studies, surveys, and naturalistic observations: to describe characteristics of people, such as their behaviors, attitudes, opinions, and demographic information. All of these characteristics are called variables. A variable is a characteristic that can take on different values for different members in a group—for example, gender is a variable, and male-female are the different values of that variable. Other variables are numerical; for example, a variable could be how much a respondent likes school rated on a 5-point scale, and the five individual ratings that can be given are the different values. When we conduct research for the purposes of describing individuals or groups, we call it descriptive research.
Surveys and naturalistic observations can be used in correlational research, in which the goal is to discover relationships between variables, or correlations. For example, you might discover through a survey that students who give high ratings on the “liking school” question attend class more frequently than those who give low ratings. Another example: a survey conducted by an advertising agency several years ago found a correlation between golf watching and car buying; people who watch golf on television tend to buy more cars than those who do not watch golf. When both variables are numerical, a statistic called the correlation coefficient can be used to measure the direction and strength of the relationship between them.
First, the direction: A relationship, or correlation, can be positive or negative. A positive correlation is one in which high scores on one variable are associated with high scores on the other and low scores on one variable are associated with low scores on the other. For example, many faculty members have observed (no surprise) a positive correlation between the number of hours a student reports studying during the week prior to an exam and the student’s grade on the exam. High scores on studying (that is, a large number of hours studied) are associated with higher grades, and low scores on studying are associated with lower grades. On the other hand, faculty members have discovered a negative correlation between the number of times a student is absent from class and the student’s final grade in the class. A negative correlation, then, is one in which high scores on one variable (absences from class) are associated with low scores on the other (final grades). In a correlation coefficient, the direction of the relationship is indicated by the sign of the number: + for a positive relationship, – for a negative relationship.
Second, the strength, or size, of the relationship: It is given by the number itself. The strongest correlation will have a correlation coefficient of +1.0 or –1.0, meaning that the two variables are perfectly correlated. The closer the coefficient gets to zero, or the farther away from +1.0 or –1.0, the weaker the relationship. A correlation coefficient of 0 indicates that the two variables are unrelated.
To summarize:
- A correlation coefficient measures the direction and strength of relationship between two numerical variables.
- It can take on a value between –1.0 and +1.0.
- The sign of the correlation coefficient indicates the direction of the relationship.
- The number itself indicates the strength of the relationship; closer to –1.0 or 1.0 indicates stronger relationships, closer to 0 indicates weaker relationships.
variable: A general characteristic of an individual that can take on a number of specific values.
Caution: Correlation Is Not Explanation
When two variables are related to each other, you can use one to predict the other. For example (assuming the relationship we suggested above is true), if you know how often a student comes to class, you can predict how much he or she likes school. If you know how much golf someone watches on TV, you can predict how likely he or she is to buy a new car. The stronger the relationship is (the closer to +1 or -1 the correlation coefficient is), the more accurate your prediction will be.
Obviously, prediction is important, and sometimes it is all a researcher wants to know. For example, it may be enough for a marketing researcher to know that golf watchers buy more cars. Armed with this knowledge, a car company can take advantage by advertising during televised golf tournaments. More commonly, however, researchers want to know whether one variable causes another. For example, if we determine that class attendance and liking school are positively correlated, we can certainly predict who will and will not like school from their attendance patterns. Ultimately, though, we want to know what causes people to like or dislike school, so we can try to help some students like it better.
Unfortunately, however, you cannot draw a causal conclusion about two variables simply because they are correlated. In other words, a relationship between two variables does not necessarily mean that one of them causes the other. We hope this information sounds familiar because it is a follow-up to Tip #6 from Module 1, the one about spurious correlations. Let us explain now why it is a mistake to assume that correlation implies causation. There are two problems with trying to infer a causal relationship from a correlation:
Directionality problem.
As the name of this problem implies, a correlation cannot indicate whether variable A causes variable B or variable B causes variable A. For example, attending class frequently might cause students to like school more. Or it could be the other way around: Liking school causes students to attend class more frequently. So the two variables might be causally related, but we do not know the direction.
Third variable problem.
Perhaps some third variable causes the effect that you are interested in. For example, perhaps frequency of attending class and liking school are not causally linked at all. Rather, there may be some third variable, or factor, that causes (or is related to) both of them. Perhaps it is something like student engagement. If students are engaged and involved in school, it will cause them to attend class frequently and to like school. Or, consider the golf and car buying relationship. It seems silly to think that watching golf causes people to buy cars. Rather, there is some third variable, in this case probably income, that causes people to buy more cars. Income also happens to be related to golf watching.
Remember the phrase that researchers use to remind themselves not to misinterpret correlations: Correlation does not imply causation.
Keep in mind, though, that the two variables in question might indeed be causally related. For example, many faculty members certainly believe that spending a lot of hours studying for an exam will cause you to get a better grade. All we have said is that the research methods we have discussed so far can only reveal correlations; they do not allow you to draw the causal conclusion you might seek. For that you need experiments. (sec 2.3)
Debrief
- Try to think of examples you have encountered of someone making the mistake of generalizing to a group of people from a single case.
- Try to think of examples you have encountered of someone making the mistake of drawing a causal conclusion from a correlation (even if it was not part of a research study).
2.3 Research Methods Used to Determine Cause and Effect
Activate
- How do you define the word experiment? How might your definition differ from the definition that psychologists use?
- How could you know whether ingesting caffeine improved memory for course material? Think carefully. What would you have to observe and what would you have to control to find an answer to this question?
Case studies, naturalistic observations, and surveys, although they are useful for describing phenomena and relationships between variables, may leave us wanting to know more. It may not be enough to know that two variables are related; we often want to know why they are related. Specifically, does one of them cause the other? For example, does playing violent video games cause aggression? Does high self-esteem cause happiness? In order to be able to draw a conclusion that one thing causes another, researchers turn to experiments as the method of choice.
Experiments
The term experiment has a technical meaning that is very different from the way it is used in everyday conversation. When people say that they are going to try an experiment, they mean that they are going to try out some new plan, just to see if it will work. To a researcher, an experiment is a far more precise concept.
The basic idea behind experiments, as researchers use the term, is quite simple. There are two main principles:
If you think one event is a cause and another its effect, you simply manipulate, or change, the cause and check what happens to the effect.
If you can rule out alternative reasons that the effect might have changed, you may conclude that the first event was indeed the cause.
Although the basic idea of experiments is simple, there are several important elements that make experiments a bit complicated.
Manipulate the Cause and Measure the Effect.
Now for an example so that you can see how these basic principles apply to an actual experiment.
Throughout this module, we have presented several ideas about why students might dislike school, based on potential case studies, surveys, or naturalistic observations. Of course, this is a very complex question, one with multiple answers. An individual experiment cannot examine every possible factor involved in a phenomenon, so a researcher should “divide and conquer.” (sec window 4) You should focus on a particular part of the problem, leaving other research questions for another day or another researcher. For example, you might narrow your focus on the ways that parents and teachers try to get children to complete their schoolwork.
Now it is time to move to the experiment. It seems rather unethical to purposely create children who dislike school (besides, it sometimes seems that we do a good enough job accidentally). Instead, researchers have come up with a research scenario that realistically mimics the effects we are interested in without causing any serious lasting damage. One specific experiment was conducted by Mark Lepper, David Greene, and Richard Nisbett (1973); instead of trying to cause children to dislike school, they tried to get them to dislike coloring. Lepper, Greene, and Nisbett proposed that controlling the children by providing rewards for an activity will cause them to dislike the activity—in other words, this was their hypothesis. (sec 2.1) To test this hypothesis, the researchers manipulated the cause (providing rewards) and checked whether the effect (liking coloring) changed.
The supposed cause is called the independent variable. It is the variable that was manipulated, or changed by the researchers. They had two groups of children: One was given a reward for coloring, and one was not; these are the two levels of the independent variable. The experimental group, the one the researchers were interested in exploring, was the group of children who got the reward. The control group—in this experiment, the group who did not get a reward for coloring—is a baseline group to which the experimental group can be compared.
The researchers predicted that the independent variable would influence how much the children like coloring. Liking coloring is the dependent variable—the supposed effect, or what the researcher measures. (To help you remember it, remind yourself that the dependent variable depends on the independent variable.) The researchers needed a measure of how much the children liked to color. In many cases, a survey can be used as a dependent variable—for example, simply ask the children how much they like to color. Because the children in this experiment were quite young, however, a survey seemed a rather poor choice. Instead, the researchers simply timed how long the children chose to color during a later free-play period.
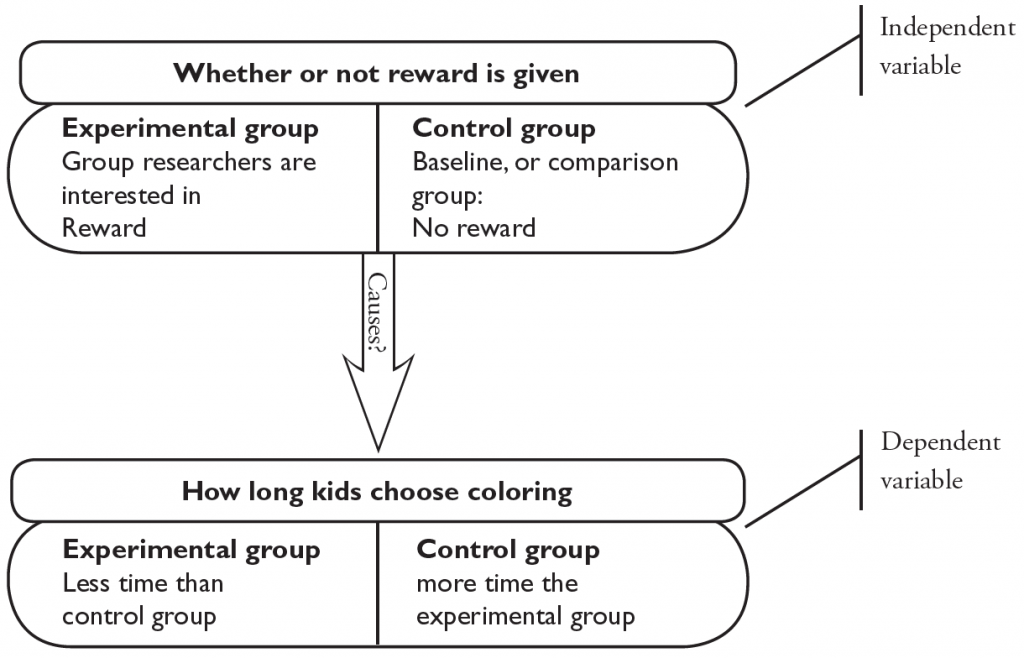
control group: The group to which the experimental group is compared.
dependent variable: The supposed effect. This is what the researcher measures.
experimental group: The group in which the researcher is interested.
independent variable: The supposed cause. This is what the researcher manipulates.
Rule Out Alternative Explanations.
So, the first principle of experiments is to manipulate the cause (independent variable) and measure the effect (dependent variable). In order to conclude that the manipulation is what caused any observed effect, the researcher must also apply the second principle of experiments and be able to rule out alternative explanations. The two main types of alternative explanations are:
- The two groups were not the same at the beginning of the experiment.
- The two groups were treated differently during the experiment.
Think about the first alternative explanation. If one group already liked coloring more than the other at the beginning of the experiment, a difference at the end could reflect this preexisting difference, not any effect of the reward. In order to ensure that the two groups are equal beforehand, the researcher can use random assignment to groups. By simply randomly assigning children in the experiment to be in the control and experimental groups, the researchers are reasonably assured that the two groups will be equal in terms of how much they like coloring to begin with, how long their attention spans are, how much they like other activities—any variable that might be of interest. Although a very simple technique, random assignment is quite effective, as long as the groups have at least 20 members each (and even more effective when the groups are larger; Hsu, 1989).
Now think about the second alternative explanation. The two groups must be treated the same throughout the experiment so that the only difference between them is that one gets the reward and one does not. For example, suppose the group that got the reward used a different set of coloring books, one that had unappealing characters in it. If they later disliked coloring it might be because of the reward or it might be because of the bad coloring books. There is no way of knowing for sure because the coloring book used was an extraneous variable or confounding variable, one that varies along with the independent variable (everyone who was in the experimental group got the bad coloring book, while everyone in the control group got the good coloring book). The researcher must make every effort to control these extraneous variables,ensuring that the different groups are treated the same (except for the independent variable, of course). Whatever is done to one group must be done to the other.
Good researchers exert strong control over the experimental situation—they manipulate only the suspected cause, assign participants to groups randomly, and treat the groups identically by controlling extraneous or confounding variables. As a consequence, they can conclude that the variables they are examining are indeed cause and effect with a high level of confidence.
confounding variable: A variable that varies along with the independent variable. If confounding variables are not controlled, the researcher cannot conclude with confidence that any change in the dependent variable was caused by the independent variable. Same as extraneous variable.
extraneous variable: A variable that varies along with the independent variable. If extraneous variables are not controlled, the researcher cannot conclude with confidence that any change in the dependent variable was caused by the independent variable. Same as confounding variable.
random assignment: The division of participants into experimental and control groups so that each person has an equal chance of being in either group. It ensures that the two groups are equivalent. (Do not confuse random assignment with random selection, which applies to a person’s inclusion in a sample.) (sec 2.2)
There are three important confounding variables or extraneous variables three different kinds of confounds or extraneous variables that you want to make sure that the experimenter accounted for. First is the possibility of a placebo effect, which is a situation in which research participants’ expectations or beliefs alone can lead to a change in the dependent variable. For example, suppose you are testing whether Omega-3 fatty acid supplements can improve memory. You randomly divide your participants into two groups: your experimental group gets Omega-3 supplements and the control group gets nothing. Then, you test their memory. It turns out that the simple belief that the supplement can improve memory might do just that, and that is what the placebo effect is. You should realize that it is a confound because everyone in the experimental group knows that they have the Omege-3 and no one in the control group does.
The second issue is closely related to the placebo effect; it is called participant demand. It begins with two happy truths. First, participants are not passive lumps in research projects. Rather, they often actively try to think about, to figure out the purpose of the study they are involved in. Second, very few people are jerks. So once a participant thinks they have the study figured out, they try to produce the behavior expected of them. In the case of the Omega-3 study, they might assume the pills are supposed to improve their memory, try harder, and therefore improve their memory.
Note, in both placebo effect and participant demand, there is nothing about the Omega-3 itself that is improving memory, it is the participants’ expectations and beliefs. A third issue comes from the experimenters’ expectations and beliefs, so it is called experimenter expectations. If the experimenters strongly believe that Omega-3 will improve memory, they might subtly influence the participants to help them improve their memory, for example, by being extra encouraging with the experimental group.
Perhaps you noticed something about all three of these issues. It is the knowledge about who is in the experimental group and who is in the control group that is at the root of the problem. If we fix that, we fix the problem. The double-blind procedure fixes the problem. Double-blind means that both the experimenters and the participants do not know who is in the experimental group and who is in the control group (in other words, they are both blind to the conditions). As long as the experimenter creates a control group that seems equivalent to the experimental group, these three confounds are controlled. Keep in mind, this often means creating a placebo condition for the control group—a condition that looks just like the experimental condition, but without the essential part of the independent variable. You can see this most clearly in the case of an experiment with some sort of pill. The placebo would be a pill that looks and tastes exactly like the Omega-3 pill, but has no Omega-3 in it.
Complex Experiments and External Validity
So far, we have described a situation in which researchers caused children to dislike coloring and suggested that we can use that result to draw conclusions about why some students dislike school. A researcher must be cautious about generalizing from one experiment to other situations. External validity refers to the extent to which the experimental situation can be generalized to other situations, particularly to the real world.
One way to increase external validity is to repeat (replicate) the experiment in a number of different situations. For example, researchers can demonstrate the effects of providing rewards on liking for other activities, such as other games or sports. The more situations in which we can observe the phenomenon, the greater confidence we can have when we try to generalize it to an untested situation.
A second way that researchers can make their experiments more realistic (thus increasing external validity) is by making them more complicated. For example, instead of simply offering a reward versus no reward, the researcher can offer different levels of reward. In the original Lepper, Greene, and Nisbett experiment, there were actually three levels of the independent variable: Some children were given an expected reward, some were given an unexpected reward, and the rest were given no reward. Essentially, there were two experimental groups (the two reward groups) and one control group. Also, a researcher can introduce a second independent variable and manipulate both independent variables simultaneously. For example, a researcher might add an independent variable for “type of reward,” and possible levels could be “money” and “candy.” Experiments with more than one independent variable are called complex experiments, and they are sometimes more desirable than simple experiments because in real life the world also typically changes across multiple dimensions at the same time.
By the way, a researcher is not limited to two independent variables. It is possible to design experiments with several independent variables, each with several levels. But you should realize that the more complex the design, the more difficult it can be to interpret the results. Researchers often limit themselves to three or fewer independent variables per experiment.
complex experiment: An experiment in which a researcher simultaneously manipulates two or more independent variables.
Debrief
- What other strategies do you think would be useful to increase the external validity of an experiment?
- Can you think of a situation in your life in which you might be able to adapt the rough idea of an experiment in order to figure something out?
- Which research method (case study, survey, naturalistic observation, or experiment) do you think you would prefer if you were a research psychologist? What made you pick the one that you did?
2.4 Statistical Procedures to Make Research Data More Meaningful
Activate
Which opinion comes closer to your own?
- Statistics are mostly used to lie.
- I tend to trust research that refers to statistics.
Please give some reasons that support the opinion that you selected.
Psychological research often produces numbers, and researchers use statistics to make sense of those numbers. Even if you never conduct research on your own, however, it is very important that you understand how statistics are used. You will undoubtedly encounter information that is based on statistical analyses throughout your career and your everyday life. The best way to evaluate that information is to have in-depth knowledge about statistical techniques. Thus, this section has a fair amount of detail about the statistical procedures discussed. This description will not make you an expert in statistics, but it is a good start on the road to understanding and evaluating statistics.
If there is one thing that many people really distrust about research it is statistics. As Benjamin Disraeli (a British prime minister in the 1800’s) once said, “There are three kinds of lies; lies, damned lies, and statistics.” (Many people attribute this quotation to Mark Twain, who admitted that Disraeli said it first.) It is true; you can lie with statistics. You know what, though? You can also lie without them. And if someone is going to try to lie to us, we hope that they use statistics. At least then we will have a fighting chance of discovering the lie, because we understand the use and misuse of statistics.
The truth, however, is that most of the time statistics are not used to lie. Like any tool, if used correctly, statistics are very useful, even indispensable. Scientists use statistics for two purposes: to summarize information, usually called data, and to draw conclusions. Descriptive statistics are used for the first purpose, inferential statistics for the second.
descriptive statistics: Statistical procedures that are used to summarize information.
inferential statistics: Statistical procedures that are used to draw conclusions, or inferences.
statistics: Mathematical techniques that researchers use to summarize information and draw conclusions about their research.
Descriptive Statistics
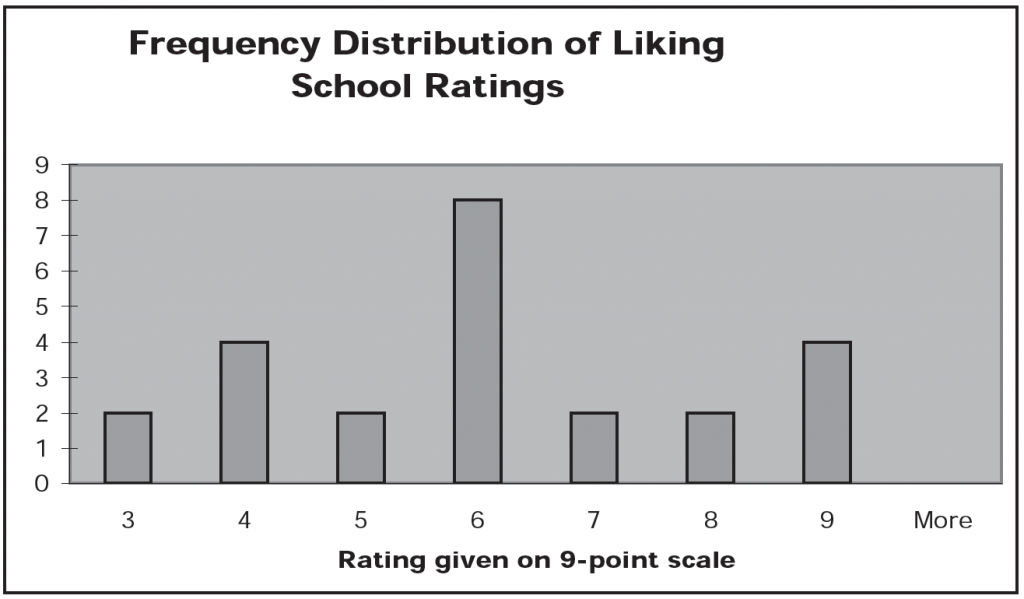
Suppose you survey a random sample of students at your college about how much they like school on a 9-point scale (9 means they like it a great deal, 1 means not at all).
These are the data you collect:
| Student | Rating for “liking school” |
Student | Rating for “liking school” |
Student | Rating for “liking school” |
| Brianna | 9 | David | 9 | Evan | 8 |
| Mike | 3 | Julia | 4 | Rhonda | 3 |
| Greg | 6 | Rasheed | 6 | Derrell | 6 |
| Kelly | 5 | Halle | 7 | Ben | 7 |
| Gayatri | 9 | Doug | 9 | Hector | 5 |
| Jenna | 6 | Maureen | 6 | Jake | 8 |
| Matthew | 6 | Taylor | 4 | Dani | 6 |
| Alexis | 4 | Jennifer | 6 | Bradley | 4 |
Even with a relatively small number of students, it would be hard to report the data for every single student any time someone wants to know how much the group likes school. Clearly, it would be easier to talk about your research if you could summarize these data.
One way you could summarize the data is by representing them graphically, as a frequency distribution. A frequency distribution chart would show how many students gave each rating point. For example, from the chart below, you can see that two students rated their liking of school a 3, while four students rated it a 9.
A frequency distribution is very useful, but sometimes it is not enough of a summary. We might want to be able to report our results very briefly, using at most a number or two. In addition, if we want to conduct more advanced statistical tests designed to help us draw conclusions (inferential statistics—described below), we will need to provide the summary numerically. That is where the descriptive statistics known as measures of central tendency and measures of variability come in.
Measures of Central Tendency.
Measures of central tendency tell you what a typical rating (or score) is, an obviously important piece of information if you want to summarize. The three specific measures of central tendency that you will encounter are the mode, median, and mean. Each represents a different way of defining what it means to be a typical rating.
One way to define a typical rating is as the most common one; this is the mode. The mode, then, is the most frequently occurring score. In the example above, the mode is 6; eight of the students rated their liking for school a 6, and no other rating point had as many students. The mode is also a useful measure when you have non-numerical data, such as gender.
The mode has a significant limitation, however. If you use it to report your typical rating, you only know what the single most common rating point is. What if there are other rating points that have nearly as many students? For example, what if our frequency distribution looked like this, with a few more students rating school a 9?
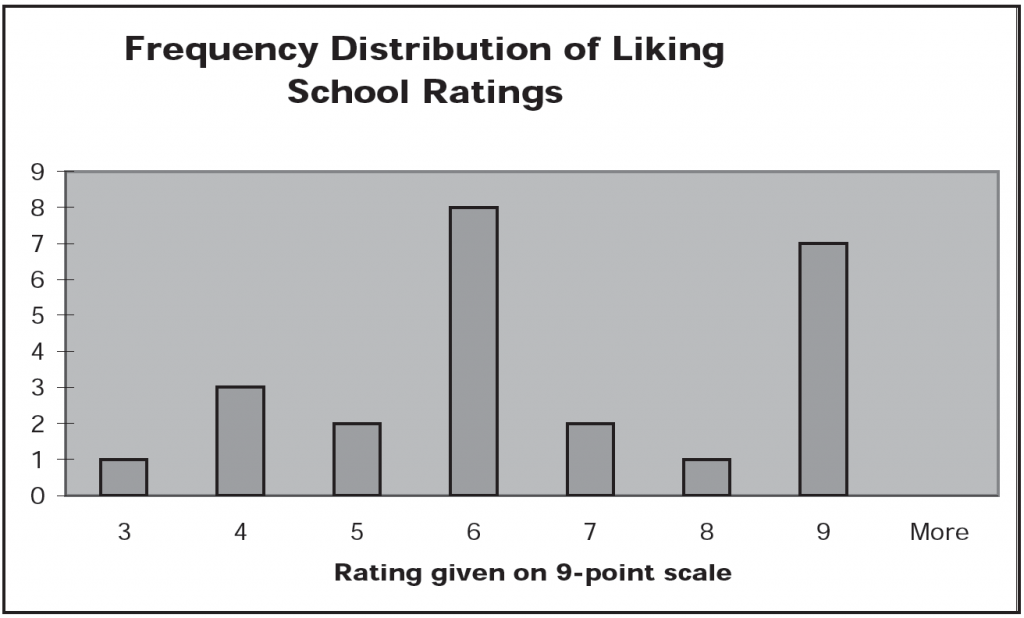
Reporting the mode, 6, as the typical rating seems somewhat misleading in cases like this, given that nearly as many students rated school a 9 as rated it a 6. In short, the mode uses a single rating only and discards information about all of the other numbers in the distribution. Thus researchers often opt to use a measure of central tendency that takes all of the ratings into account.
One measure of central tendency that accomplishes this goal, which is also the measure of central tendency most commonly used, is the mean. The mean is what you probably know as the average; to compute it you simply add up all of the ratings in the distribution and divide by the number of students. The mean is the measure of central tendency that retains the most information about the original distribution, because you use all of the ratings to calculate it. For example, the mean of the first distribution is 6.1. The mean of the second distribution (the one with the extra 9’s in it) is 6.6.
The main situation in which you should be cautious about using the mean as your measure of central tendency is when there are extreme scores. Think of it this way: If Bill Gates came to your next class, the mean net worth of the class would be approximately 30 billion dollars. Clearly, a figure like this is not exactly a typical score. In cases such as this, you are safer reporting the mode as the measure of central tendency.
In cases when the mean in not appropriate because of extreme scores, you might also choose to use the median as your measure of central tendency. The median is the rating that falls right in the middle of the distribution; half of the ratings are above and half below it. To find the median, simply order the students from lowest to highest rating and find the student that is in the middle (if the middle is between two scores, average them to get the median). The median is more informative than the mode because it does use all of the scores. Still it is not as sensitive as the mean, which uses all of the scores to calculate an average, rather than simply counting all of the scores. The median of both distributions in this section is 6, the same as the mode.
It is worth stepping back at this point and realizing that statistics can be misleading. Sometimes, researchers misuse statistics intentionally, sometimes inadvertently. We have already mentioned the first way that these measures can be misused: by allowing a small number of cases to influence the measure (that is, reporting the mean when the median or mode would be more appropriate because of extreme scores).
A second important misuse of central tendency is to confuse the idea of typical score with typical person. Suppose we give an exam for which half of the students get a score of 100% and half get a 50%. The mean (and median) score is 75%. We have been referring to this as the typical score, but in this situation, there is not a single person who earned a 75%. The mean is a statistical figure that need not correspond to an actual person. Hence, it would not make any sense to say that the typical student in the class received a 75%.
A related misuse is to take several measures of central tendency for different variables and use them to draw a composite, acting as if the composite was a typical person. For example, suppose the following are all true of graduates at your school:
- Modal (most frequently occurring) gender: female
- Modal major: business administration
- Mean GPA: 3.2
- Mean time to graduation: 4 years, 2 months
You cannot conclude that the typical graduate at your school is a female business administration major with a GPA of 3.2 who took 4 years, 2 months to graduate. Again, there may not be a single person at the whole school who matches this composite. Reporting a composite like this can be misleading in other ways, too. For example, although the overall mean GPA may be 3.2, the mean GPA of females is probably higher than 3.2 because females tend to have higher GPA’s than males.
mean: The arithmetic average of a distribution (add up all scores and divide by the number of scores); a measure of central tendency.
measure of central tendency: A descriptive statistic that conveys what a typical score of a distribution is.
median: The score in the middle of a distribution (half the scores are above, half are below); a measure of central tendency.
mode: The most frequently occurring score in a distribution; a measure of central tendency.
Measures of Variability.
A second useful piece of summarizing information is how close the rest of the scores are to the typical score. We use measures of variability for this purpose.
You will generally encounter two main measures of variability: The variance is a statistical measure of the average squared difference of each individual score from the mean, which tells you how spread out the distribution of scores is. When the variance is computed, the units for the resulting statistic are squared distances. Because of this, many researchers report the standard deviation,which is the square root of the variance. In addition to their usefulness in summarizing a distribution, these measures of variability are needed in order to calculate inferential statistics.
measure of variability: A descriptive statistic that conveys how spread out a distribution is.
variance: A measure of variability composed of the average squared difference of each individual score from the mean in a distribution.
standard deviation: A measure of variability calculated as the square root of the variance of a distribution.
Inferential Statistics
Once data have been summarized using descriptive statistics, researchers will usually want to draw conclusions about them. For this, they use inferential statistics. Suppose you did the survey of liking school and found that the ratings given appeared to differ by major. Specifically, business majors rated their liking of school a mean of 6.2, while psychology majors rated it an average of 8.3. You might look at the difference, 6.2 versus 8.3, and think that it seems like a pretty big difference. On the other hand, you might think that this difference is quite small, so small that it might simply have resulted from random variation. After all, people are all different from each other. If you take any two groups of students at random and compare their average ratings for liking school, you will very rarely find the exact same number for both groups. The key question is, how different do the two averages need to be in order for you to believe that it is a reliable difference and not one that is just a random variation?
Inferential statistics allow you to draw this conclusion. A difference between groups is called statistically significant if the inferential statistics determine that it is very unlikely that you would observe a difference as large as the one you did if, in fact, there is no true difference. In other words, there must be some real, reliable difference between the groups that led to the different average scores. There are many different specific inferential statistical techniques; a researcher chooses the appropriate one to use based on the specific characteristics of the research.
Inferential statistics can also be misused. For our money, the most important point about inferential statistics is that statistical significance and practical significance (or importance) are completely different concepts. It is an unlucky accident that the word significance is used in both statistics and everyday language. The two senses of the word are completely unrelated. Statistical significance refers to the reliability of an observed difference. As we said above, a difference, is called statistically significant if it is unlikely that you would observe a difference as large as the one you did in your research if, in fact, there is no true difference in the world. Practical significance refers to the importance of some event. Many people think that the two concepts are the same. It is simply the case that a statistically significant research result might have no practical significance whatsoever.
Some people also act as if the use of inferential statistics automatically confers legitimacy on a research result. Although a difference may be statistically significant, if it is based on a poorly designed study, the conclusion will be suspect.
Richard Nisbett and his colleagues (1983; 2002) have found that training in statistics helps people to avoid statistical reasoning errors, which can lead to baseless beliefs. (sec 1.2) Many people dread and avoid taking statistics classes in college. But perhaps if they realized the great benefit of understanding statistics for their everyday judgments and the evaluation of information presented to them, they would approach statistics classes more eagerly.
inferential statistics: Statistical procedures that researchers use to draw conclusions about their research.
statistical significance: A judgment that a difference observed in a research project is larger than what you would expect if, in fact, there is no true difference in the world. You would therefore judge that your observed difference reflects a true difference.
Debrief
Once again, which of the opinions from the Activate section comes closer to your own?
- Statistics are mostly used to lie.
- I tend to trust research that refers to statistics.
Again, please give some reasons that support the opinion that you selected. This time, please also give some reasons that support the opinion you did not select.
2.5 Ethics in Research
Activate
- How does it make you feel if someone purposely embarrasses you, makes you feel inferior, or harms you?
- Have you ever participated in a survey or other psychological research? Was it a pleasant or unpleasant experience?
If you are attending a large school, particularly one with a graduate program in psychology, you will likely be given the opportunity to participate in research as part of your General Psychology course (sometimes, that “opportunity” feels a little bit like a requirement). If you advance in psychology, you will even have the opportunity to conduct your own psychological research; if you go to graduate school, it will probably be a requirement. The rest of you might gain first-hand exposure to psychological research methods as potential participants in marketing research projects. In all three situations it is important to understand the goals and procedures for conducting ethical research.
Participating in research projects as part of a General Psychology course is an excellent way to see first-hand the research methods that are used to generate the psychological knowledge that is described in this book. (secs 2.2/2.3) Some students get interested enough in psychological research from their experiences as participants that they end up going to graduate school as a result.
On the other hand, if participating in studies is unpleasant, people will become hostile to research and psychology. Therefore, it is in researchers’ best interest to make their projects as pleasant, interesting, and educational for participants as possible. The ethical guidelines that have been developed by the American Psychological Association can help researchers achieve these goals.
Imagine the following scenario. As a participant in a research study, you are asked to have a conversation with five other students about your adjustment to college life. In order to help you speak honestly and freely, the conversation will take place over an intercom, so you are the only person in a room. During the conversation, one of the students lets it slip that he suffers from epilepsy. A few minutes later, he actually has an epileptic seizure and cries out for help before choking and going silent. As you sit in your room wondering whether you should help, how you should help, or whether the other participants in the conversation helped, the experimenter walks into your room and informs you that the study is over. The experimenter was not, as he had stated, interested in your adjustment to college life, but was testing whether or not you would help in an emergency. All of your anxiety and distress was for naught; the student with the seizure was a tape-recorded actor. As a consequence of participating in the study, you are embarrassed, distressed, and feeling more than a little guilty over your failure to help.
Based on what we have told you about the experiment so far, is this research ethical or unethical? In other words, should the researcher have been allowed to subject you and the other participants to such treatment?
Some people say no. The treatment of the research participants was so distressing, so upsetting that the research should not have been allowed. This is the research equivalent of the doctor’s Hippocratic oath, which is “Above all, do no harm.” Specifically, you might note that the researchers deceived the participants about the true nature of the experiment, led them into a very distressing situation, and made them realize that they would have allowed a person in need to die. It was wrong to do these bad things to the participants, so the research was unethical.
Others argue that it is too simplistic to decide that the research was unethical only because it was distressing to the participants. They wonder why the study was conducted, what we learned from it. For example, how many people failed to help the student with the seizure? In the experiment just described, originally conducted by John Darley and Bibb Latane (1968), 40% of the participants did not go for help at all during the experiment (the period after the seizure until the end of the experiment was four minutes). In addition, even those who did go for help did so fairly slowly. This sounds like an important fact to learn about people. Perhaps the distress suffered by the participants is justified by the potential benefit of learning something new and important about human behavior.
This second argument corresponds to the way that many decisions about the ethics of a research project are made. The potential benefits of a study to society are weighed against any adverse treatment of participants.
By the way, some people, upon hearing the results of research like this, are tempted to conclude that the research is ethical because the participants deserved the distress that they suffered. They failed to help someone in trouble, so they deserve to feel bad about themselves. This conclusion, however, fails to take into account the basic lesson taught by studies like this one. Very many people, in some experiments most people, fail to help. The experiment was specifically set up to create a situation in which people would fail to help. The ease with which the researchers were able to get people to fail to help is not an indication of the weakness or badness of the individual participants but of the power of a situation to influence people’s behavior.
Ethical Guidelines for Human Research
Psychologists usually conduct research under the auspices of a government agency, a corporation, or a university. Regardless of where the studies are conducted, the sponsor usually requires that research participants be treated ethically. Of course, researchers should be sensitive to their treatment of human participants in any case.
Decisions about whether a research study is ethical are made by the institutions where the research will be conducted. These decisions are often made by institutional review boards, and they are made in reference to a set of ethical guidelines that have been prepared by the American Psychological Association (APA).
Institutional Review Boards.
The U.S. federal government requires that any research that is supported or regulated by any federal agency must be approved by an institutional review board, or IRB. An IRB is a committee of institutional and community members who evaluate all proposed research that involves human participants at an institution. Most research that is conducted at colleges and universities across the United States is covered under this policy.
In addition to approving research projects, IRBs also ensure that the specific procedures conform to the guidelines for ethical research. They ensure that informed consent is obtained, that participants are treated with respect, and that they are given opportunities to withdraw from the study and to receive the results.
institutional review board (IRB): A committee composed of members of an institution where research is to be conducted and community members, whose job it is to approve or disapprove individual research projects and to ensure that ethical guidelines are followed when those projects are conducted.
APA Research Guidelines.
In psychology, guidelines for ethical research have been established by the American Psychological Association, most recently revised in 2017 (APA, 2017). Although the full guidelines for ethical behavior of psychologists are quite detailed—there are ten individual standards, each with multiple sub-requirements—the specific guidelines that pertain to research are quite understandable and sensible. The guidelines deal with several important aspects of research procedures:
Informed consent. This guideline is the cornerstone of ethical treatment of research participants. Basically, participants must know “what they are signing up for.” Researchers must obtain voluntary consent from participants in a research study only after they have fully informed the participants about the procedure, paying special attention to any risks involved. Any piece of information that might reasonably lead some people to decline to participate must be disclosed. Participants also must be informed whether there is any consequence if they choose to terminate participation before the study is completed. They must also be informed of the degree to which the results are confidential. For some studies, however, fully informed consent would literally ruin the research. Consider, for example, the study on helping behavior described earlier. If participants had been informed that they were about to take part in an experiment designed to test whether they would help someone experiencing a medical emergency, they would surely have been quicker to offer help. The research would have discovered little about how people are actually inclined to act in an emergency. In short, sometimes it is necessary to disguise the true purpose of a study. These “deception studies,” as they are called, must undergo extra scrutiny by IRBs, and the researcher is obliged to take precautions to minimize any potential negative effects of the deception. First, the researcher must be able to justify that the benefits of the research outweigh the cost of deceiving participants. They must also demonstrate that there is no alternative to the deception. Then, as soon as possible after the conclusion of the research session, the participants must be told about the deception, why it was necessary, and the true purpose of the study.
Freedom from coercion. The principle of informed consent implies that potential research participants must not be forced, or coerced, to participate in a study. This is a simple seeming requirement, but coercion can be quite subtle. Excessively large incentives for participation, for example, are considered a form of coercion. Also, it is common for psychology professors to conduct research using students from their school, sometimes from their own classes. Often, course credit or extra credit is awarded for participation. In such cases, an equivalent alternative opportunity for students to receive the credit must be provided. For example, a professor cannot require students to choose between participating in a one-hour experiment or writing a 20-page paper. This false choice is really coercion in disguise.
Respect for people’s rights, dignity and safety. Researchers must respect participants right to privacy or confidentiality (unless they waive those rights through informed consent). Participants must also be protected from harm. Obviously, physical harm is included in this guideline, but so is psychological harm, such as feeling embarrassed or foolish. In the study of people’s helping behavior, for example, the participants needed to be told that their failure to help is what the psychological theory predicted and that very many people put into the same situation also fail to help. If a researcher discovers that a participant was harmed in any way, he or she must take reasonable steps to reverse the harm. IRBs can be very conservative when it comes to the potential harm guideline. Often, they reject any study that subjects participants to greater distress than they would expect to experience in the normal course of a day.
Debriefing. After the conclusion of a study, research participants are offered the opportunity to learn about the purpose and results of the full study.
The Case for Strict Ethical Guidelines
The research section of the APA guidelines are only a portion of the entire APA Code of Ethics. The rest of the code describes the guidelines that professional psychologists must follow in the publication of their research, in their relationships with clients or patients, and in their teaching activities. You can see the entire ethics code at www.apa.org/ethics.
Most psychological research does not pose an ethical problem. Research procedures and treatment of participants are generally quite tame, usually much less distressing and threatening than many events that we experience every day. So is this great attention paid to ethics overkill? Should institutional review boards be more lenient and allow research to be conducted without seeking informed consent and without making the research educational for participants?
Probably not. As we mentioned before, if the discipline regularly allowed research participants to be treated with disrespect or misused in some way, before long all research would grind to a halt as participants became unwilling to participate (or coerced participants purposely sabotaged the research).
Besides, some research does present a sticky ethical situation, and IRBs may be the only way to identify the risks and protect potential participants. If a researcher wants to know if temporarily lowering people’s self-esteem makes them more aggressive, for example, there is no alternative to a research procedure that will make participants feel inferior, such as falsely informing them that they performed very poorly on some test. In the Darley and Latané study described above, in order to examine people’s reactions in an emergency, the researchers had to create a realistic emergency, complete with serious consequences and the accompanying anxiety and distress. The simple fact is, many important discoveries were made during research that inconvenienced, embarrassed, stressed, or even insulted research participants. When this happens, though, it is absolutely essential that the researcher make every attempt to reverse any negative effects for the participants.
Ethical Guidelines for Animal Research
Animal research is often very controversial. Animals cannot decline to participate, and they often cannot communicate to us that they are experiencing distress. Fortunately, very little research in psychology is conducted with animals. And of the psychological animal research that is done, a relatively small portion harms the animal in any way.
The decision to allow animal research is based on the same cost-benefit argument used to evaluate human research: Does the benefit outweigh the potential harm? Many important discoveries were made by conducting research on animals. For example, one of the most important theories of depression, called learned helplessness, was examined in research with dogs and rats (Seligman & Maier 1968; Rosellini & Seligman 1975). (sec 24.2) These discoveries have improved, even saved, the lives of millions of people. According to the cost-benefit approach, the cost of harm to a few animals is small compared to the benefit to people.
Nevertheless, the famous chimpanzee observer Jane Goodall (1999) has suggested that captive animal research, although sometimes currently necessary in order to save human lives, is unethical. Hence, we should strive to develop alternative experimental methods with the goal of eventually ending animal research.
In the meanwhile, we must treat captive animal research subjects as humanely as possible. The American Psychological Association provides guidelines for the ethical treatment of animals in research. Psychologists who supervise research with animals must be trained in humane research methods and experienced in caring for animals. Anyone involved in the research must receive training in research and care as well. Harming animals is allowed only when absolutely no other procedure is available. If surgery is performed, anesthesia for pain and follow-up treatment for infection must be provided. If an animal’s life must be terminated, it must be done quickly and with a minimum of pain.
Debrief
When deciding whether a research project is ethical, which approach do you prefer?
- Ethical status is decided by the features of the research project alone.
- Ethical status is decided by an analysis of the tradeoff between the costs and benefits of a research project.
How might you apply these approaches when deciding whether your own non-research activities are ethical?
Any event that is noticed or detected through the senses; observations are what scientists try to organize and explain.
A statement or set of statements that explain and organize observations and generate hypotheses.
A prediction that is generated from a theory.
A research method in which a researcher examines an individual in great detail.
A research method in which a researcher asks questions to a sample of individuals.
A sample that resembles that population from which it is drawn.
A sample for which every member of the population has an equal chance of being selected.
A sample in which the researcher selects participants who are easy or convenient to find.
A sample for which the participants themselves are completely free to choose to participate. The researcher makes no attempt to control the sample or assure that it is representative.
A research method in which a researcher observes participants in their natural environment, without their knowledge and without interfering in the behavior in any way.
A general characteristic of an individual that can take on a number of specific values.
Research conducted with the goal of describing individuals' or groups' characteristics.
Research conducted with the goal to discover relationships or associations between variables
A relationship between two variables.
A statistic that measures the direction and strength of a relationship between two numerical variables. The sign of the correlation coefficient indicates the direction, and the number itself indicates the strength of the relationship.
A research method in which the researcher manipulates a supposed cause and measures the supposed effect. It is the research method that allows one to conclude that one variable causes another one.
The supposed cause. This is what the researcher manipulates.
The group in which the researcher is interested.
The group to which the experimental group is compared.
The supposed effect. This is what the researcher measures.
The division of participants into experimental and control groups so that each person has an equal chance of being in either group. It ensures that the two groups are equivalent.
A variable that varies along with the independent variable. If extraneous variables are not controlled, the researcher cannot conclude with confidence that any change in the dependent variable was caused by the independent variable.
A variable that varies along with the independent variable. If confounding variables are not controlled, the researcher cannot conclude with confidence that any change in the dependent variable was caused by the independent variable. Same as extraneous variable.
The degree to which the results of an experiment can be generalized to the outside world.
An experiment in which a researcher simultaneously manipulates two or more independent variables.
Mathematical techniques that researchers use to summarize information and draw conclusions about their research.
Statistical procedures that are used to summarize information.
Statistical procedures that are used to draw conclusions, or inferences.
A type of chart that shows how many research participants received each possible score (or gave each possible rating).
A descriptive statistic that conveys what a typical score of a distribution is.
The most frequently occurring score in a distribution; a measure of central tendency.
The arithmetic average of a distribution (add up all scores and divide by the number of scores); a measure of central tendency.
The score in the middle of a distribution (half the scores are above, half are below); a measure of central tendency.
A descriptive statistic that conveys how spread out a distribution is.
A measure of variability composed of the average squared difference of each individual score from the mean in a distribution.
A measure of variability calculated as the square root of the variance of a distribution.
A judgment that a specific research result is unlikely to occur by chance alone, which allows a researcher to conclude that some observed finding is a reliable one.
A committee composed of members of an institution where research is to be conducted and community members, whose job it is to approve or disapprove individual research projects and to ensure that ethical guidelines are followed when those projects are conducted.
