6. Momentum
Summary
Momentum
Momentum is a quantity that describes the amount of motion of an object. It is a vector, indicating that it has both a magnitude and a direction. The symbol for momentum is the lowercase letter  . The units for momentum are kilogram-meters per second (kgm/s), or newton-seconds (Ns). Both of those units are interchangeable, meaning that either one can be used.
The quantities that affect momentum are mass and velocity. Before we quantify this using an equation, consider how mass and velocity will affect the momentum of an object. Imagine that you have a friend standing a few meters away from you who gently throws a softball to you. Think about the amount of impact, or force, the softball will have when you catch it. Then consider what would happen if the softball were thrown faster. Momentum is directly proportional to the speed or velocity of an object.
Next, imagine that same friend throwing a bowling ball to you. The impact of the bowling ball, even thrown at the same speed as the softball, would definitely be higher. Momentum is also directly proportional to the mass of an object.
Putting this into an equation, we find that

where is momentum,  is mass, and
  is the velocity of the object. Momentum and velocity are both vectors that point in the same direction. In the video below, a blue cart sits at rest on a low-friction track. When it gets impacted by the red cart, the momentum transfers from the red cart to the blue cart, causing the blue cart to move. The direction of that motion is in the same direction as the red cart. Direction cannot be ignored in vector quantities!
A pickleball with a mass of 25 g (0.025 kg) is served with a speed of 18 m/s. The magnitude of its momentum is

Do two objects with the same mass traveling in different directions have equal momentum? Momentum is a vector quantity, so we know that direction is involved. If direction is not the same in the two cases, then even if the mass and speed are the same, the momenta of the two objects are not equal.
Impulse
Impulse is a measure of the change in momentum of an object or of a system of objects. Because impulse defines the change in a quantity, the uppercase Greek letter delta ( ) will appear in the symbol. The symbol for impulse is
  , which is equal to the change in momentum
  .
.
The equation for impulse is that impulse is the change in momentum,

If the impulse is calculated for an object or system of objects whose mass does not change, then the above equation can be simplified to

Because momentum is a vector, the change in momentum (impulse) is also a vector. Make sure you pay close attention to the sign of each momentum variable when calculating impulse.
Consider an object that is initially at rest that you’d like to get moving quickly. (Perhaps you’re playing tennis and want to serve the tennis ball to your opponent, or maybe you are playing frisbee with your dog and want to get the frisbee moving nice and fast.) In order to get that object moving as quickly as possible, you will need to apply a force to the object. The change in momentum will be proportional to the force you apply. To maximize the impulse of the object, apply a large force to it.
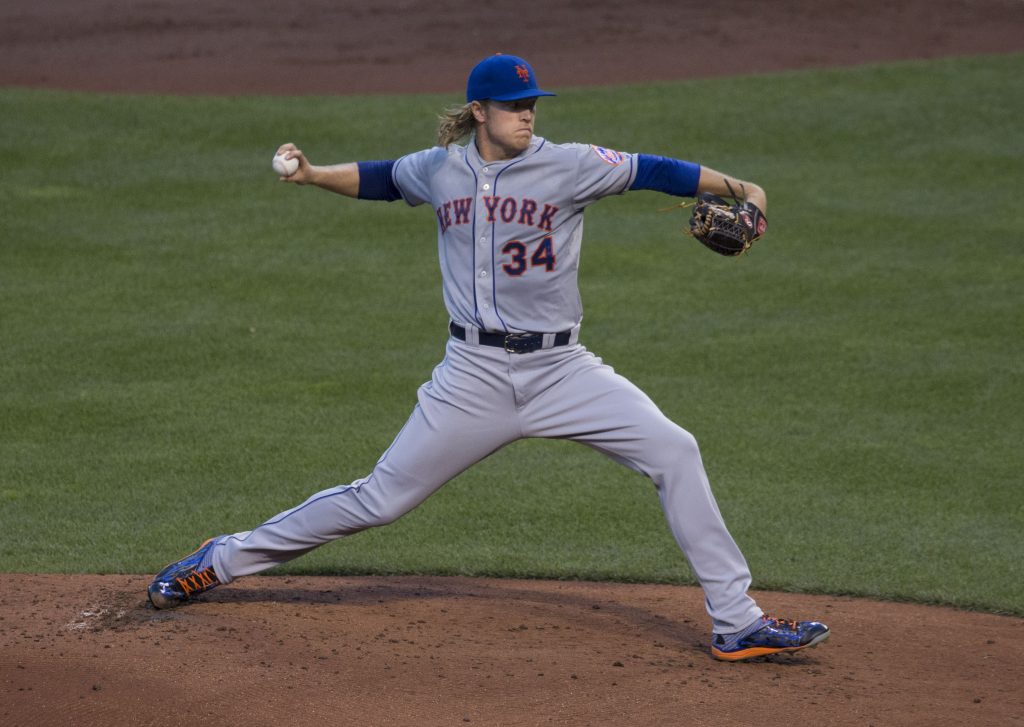
The other property that affects the change in momentum will be the amount of time during which you apply the force to the object. The longer the time duration during which the force is applied, the larger the impulse will be. This can be seen, for example, in the game of baseball, where to maximize the change in motion of the baseball, a large force on the object is applied over a long period of time. This can be seen with a pitcher’s “windup,” shown in Figure 6.1. The pitcher “winds up” by holding the baseball as far back as arm span will allow. This provides the maximum amount of time to apply a force to the baseball, causing it to increase its momentum as much as possible.
Therefore, we can derive a second equation that we can use for impulse,

where  is the force acting on the object, and
  describes the amount of time that force is applied. Force and impulse are both vector quantities, and these two vectors will point in the same direction.
To further demonstrate the concept of impulse, and the relationship with force and time, in the video below, Dr. Pasquale will throw a tennis ball to change its momentum. First, she will apply a small force over a short time (minimum impulse), a small force over a long time (medium impulse), a large force over a short time (medium impulse), and finally a large force over a long time (maximum impulse).
Because impulse means change in momentum, and momentum is a vector, it doesn’t only apply to when an object speeds up. It also applies when an object slows down or changes its direction. To speed an object up, the force applied to the object needs to be applied in the same direction as the velocity. To slow an object down, the force needs to be applied in the opposite direction as the velocity.
We can see this by looking at the impulse generated by two nearly identical balls falling down a track and hitting a block of wood, as shown in the video below. One ball bounces, and the other does not. This helps us to understand how impulse changes with and without a bounce involved in the collision.
When the non-bouncing ball is released from the track and hits the wooden board, the board is deflected slightly due to the force the ball applies to the wood during the interaction. Newton’s third law tells us that the wood will apply an equal and opposite force to the ball, slowing it down to a stop.
When the bouncing ball is released from the track, the board completely falls over. This is because the board had to not only stop the ball, but give the ball additional impulse to send it back the way it came. If the board imparts a greater impulse to the ball to reverse the ball’s direction, then the ball has to impart a greater impulse on the board to make it fall over. How can this be? It follows from Newton’s third law of motion. We know that the time of impact has to be the same for both objects. (After all, how can the ball touch the block for more or less time than the block touches the board? Obviously it can’t.) Since the force that the board exerts on the ball is equal and opposite to the force that the ball exerts on the board, the impulses must also be equal and opposite. Therefore, the bouncing ball imparts a greater impulse to the board than the non-bouncing ball.
Both balls have a mass of 10 g (0.01 kg). They both hit the piece of wood at a velocity of approximately 0.75 m/s.
The non-bouncing ball comes to a complete stop after it hits the force plate, so the final velocity is zero. The impulse of the non-bouncing ball can therefore be calculated as

The bouncing ball rebounds with a speed of approximately -0.6 m/s. (The value has a negative sign because it points to the left.) The impulse of the bouncing ball is

This provides us with quantitative evidence that the impulse is indeed greater when an object bounces compared to when it does not bounce.
Conservation of momentum
Conservation of momentum means that, in the absence of any net external force acting on a system, the momentum in that system will not change. This is known as the law of conservation of momentum.
Starting with a very simple example of conservation of momentum, consider the red cart in the video below. It starts at rest, and is pushed by Dr. Pasquale. After she removes her hand and that force is no longer being applied to the cart, it moves in the same direction at the same speed until coming to a rest at the end of the track.
The velocity data from the experiment was collected from the motion detector and is plotted below in Figure 6.2. (Download this data [XLSX, 11 kB]) The time period between 3.5 and 5.5 seconds is when the cart is moving without any noticeable external forces, and a horizontal red dashed line is included on the graph to show how constant the velocity is during that time.
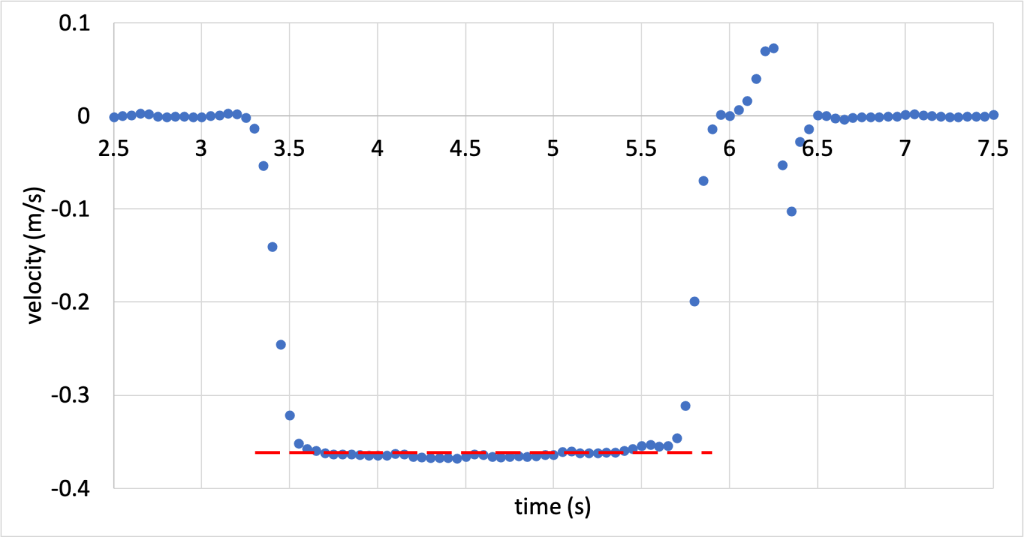
In this simple system consisting of just the cart, momentum is conserved in the absence of any net external force. (That changes, of course, when there are external forces, such as Dr. Pasquale’s hand pushing on the cart, or the cart pushing into the motion detector when it stops.)
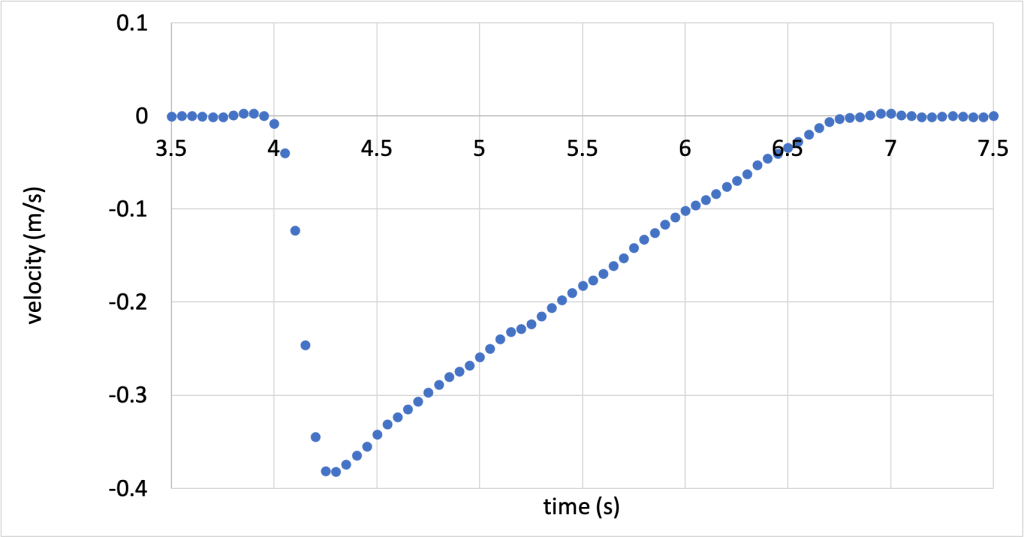
When a high-friction pad is placed on the cart (demonstrated in the video below), there is a very large external force present on the system. The track (being external to the system) exerts a frictional force on the cart. The cart slows down greatly, and it’s very clear that the momentum of the cart is not constant and therefore, not conserved.
The velocity data from this experiment was also collected, and is graphed in Figure 6.3. (Download this data [XLSX, 11 kB]) During the time period between about 4.25 and 6.75 seconds, the cart is moving on its own after having been pushed. The velocity gets smaller and smaller (the cart slows down) at a constant rate throughout this time period until it comes to a complete stop.
Next we can consider a slightly more complicated scenario. There are now two carts: a blue cart and a red cart. The blue cart is pushed into the red cart. When they come together, repelling magnets cause the blue cart to push the red cart, which subsequently moves down the track. This experiment is shown in the video below.
The velocity data during this experiment was recorded for both carts using both motion detectors, and is shown in Figure 6.4. (Download this data [XLSX, 12 kB]) Note that the velocity, while each cart is in motion, is not a flat horizontal line. This is due to the presence of friction on the track, causing each cart to slightly slow down over time. Due to this effect, we will consider the period of time immediately before (at approximately 5 s) and immediately after (at approximately 5.5 s) the collision in calculations, to reduce the influence of friction on the demonstration of conservation of momentum.
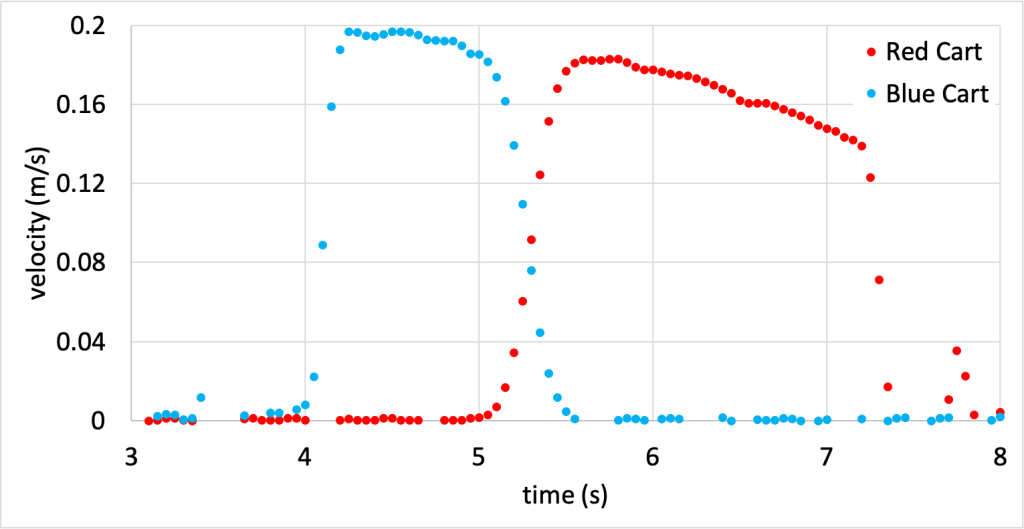
If we define the system as consisting of both the blue AND red carts, we can look at the momentum of each object before they impact and after they impact and compare. Both carts have a mass of approximately 0.4 kg.
Before the collision, the system consists of the momentum of the blue cart plus the momentum of the red cart. Both can be calculated using the momentum equation. The blue cart momentum is

The red cart has zero momentum because it is not moving. Therefore the initial system momentum is 0.072 kgm/s.
After the collision, the system still consists of both carts. The momentum of the blue cart is now zero, because it is at rest. The red cart is moving at a velocity of 0.18 m/s, and therefore has a momentum of 0.072 kgm/s. The final system momentum is 0.072 kgm/s. These two momenta are equal, demonstrating the property of conservation of momentum in a system where there is no net external force.
Now, consider that the system consists of only the blue cart. We won’t consider the red cart in our calculations any more. The momentum of the blue cart started at 0.072 kgm/s. After the collision, the blue cart has zero momentum, because it is stopped. Momentum definitely wasn’t conserved in this system! This is because the red cart, which is not part of the system, now acts as an external object that exerts an external force that slows the blue cart down and changes its momentum.
Similarly, we can consider the scenario where the system only consists of the red cart. The momentum of the red cart starts at zero, and after the collision becomes 0.072 kgm/s. The momentum is not conserved. This is because the blue cart exerts an external force that speeds up the red cart and changes its momentum.
Notice that when we define the two carts together as “the system,” the forces that they exert on each other are internal to the (two-cart) system and therefore cannot change the momentum of the (two-cart) system. Momentum is conserved.
These examples have provided us with evidence that momentum is conserved in one dimension, as all of the scenarios we considered took place along a straight line. What happens in two or even three dimensions? Is momentum still conserved in the absence of external forces? The answer is yes!
When a collision or interaction occurs in two dimensions, we can independently consider both the horizontal and the vertical directions, or x and y. All of the momentum in the x-direction will be conserved and all of the momentum in the y-direction will be conserved.
In three dimensions, we can consider a very similar outcome, but now with momentum being conserved in width, depth, and height. All three dimensions will have a conservation of momentum in the absence of external forces, as long as we consider the colliding objects together as “the system.”
Collisions
In short, a collision is when two objects interact for a very brief time. There are different types of collisions: inelastic and elastic. In all collisions that have no external forces, momentum is conserved within the system of interacting objects.
Inelastic collisions
An inelastic collision is defined by the presence of a lasting deformation of the objects that collide, or by the generation of heat during the collision (or both). A perfectly inelastic collision occurs when two objects collide and then stick together and travel as one unit after the collision.
An example of an inelastic collision would be dropping a coffee mug on the floor, the lasting deformation is the ceramic mug breaking into pieces after colliding with the floor.
Consider an inelastic collision where two carts (one red cart and one blue cart) collide. The blue cart has a mass that is twice that of the red cart, but exact mass values are unknown. Before the collision (shown in Figure 6.5, top), the red cart travels towards the blue cart (which is initially at rest) at a velocity of 2 m/s. The two carts collide and stick together. After the collision (shown in Figure 6.5, bottom), the two carts travel together at an unknown velocity.
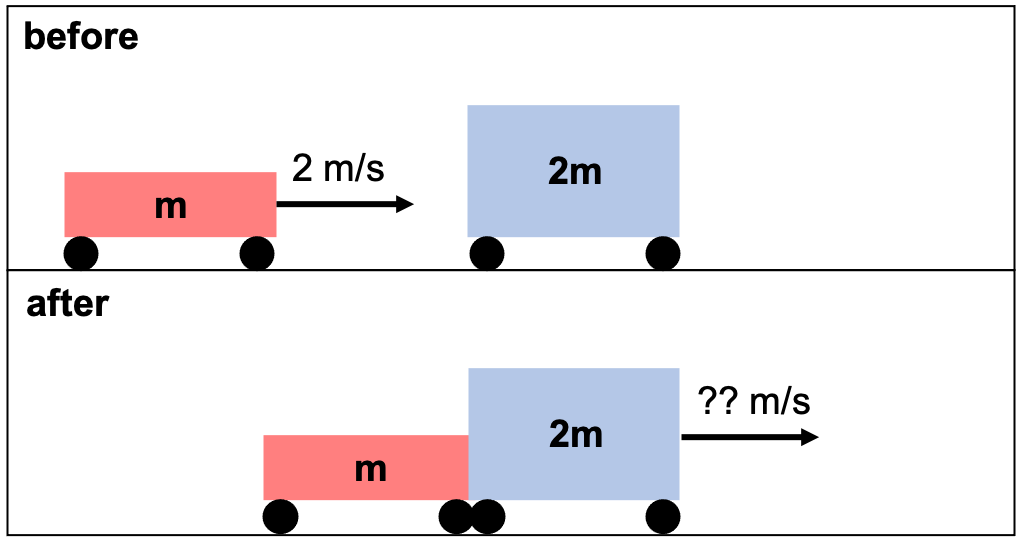
With this information, it is possible to calculate the final velocity of the system. Assuming there are no external forces (such as friction and air drag), the momentum of the system (consisting of both the red and blue carts) will be conserved throughout the collision. This means that the momentum of both carts before the collision will be equal to the momentum of both carts after the collision.
Note that both carts will travel at the same velocity after the collision ( ), as the carts travel together.

Elastic collisions
An elastic collision occurs when there is neither lasting deformation of objects in the collision, nor generation of heat during the collision. An example of an elastic collision is when two billiard balls collide together and then rebound afterward. (While in reality there will likely be a very small amount of heat generated when the two billiard balls collide, it is still a very good approximation of an elastic collision.)
The experiment shown in the video above (“Conceptual Physics: Conservation of momentum in a system” with data graphed in Figure 6.4) is an example of an (very nearly) elastic collision. The blue cart and red cart interact with repelling magnets, and because they don’t touch, they don’t experience any lasting deformation or generate any appreciable heat.
Collisions in two (or more) dimensions
In our everyday world, the collisions that occur do not always occur in one dimension (along a single straight line). Traffic collisions typically occur in two dimensions (vehicles approach each other at different angles along a flat surface). Collisions between molecules in our atmosphere occur in all three dimensions of space.
Regardless of how many dimensions are involved in the collision, the conservation of momentum will always apply in collisions in the absence of external forces. The vector sum of the momenta of all objects in the system before the collision is equal to the vector sum of the momenta of all objects in the system after the collision. In two dimensions, these vectors will have horizontal and vertical components. In the case of a collision on a roadway, perhaps more accurate descriptions would be north-south and east-west components. What each component is called (horizontal or east-west) is not as important as the fact that the components are perpendicular to each other. In three dimensions, each vector will have three perpendicular components. Each of the components before and after the collision will be conserved.
In Figure 6.6 left, two objects (a circle and a triangle) approach each other at right angles. The circle moves to the right and the triangle moves up. Figure 6.6 right shows the two objects after the collision. They travel together and have a velocity vector that points up and to the right.
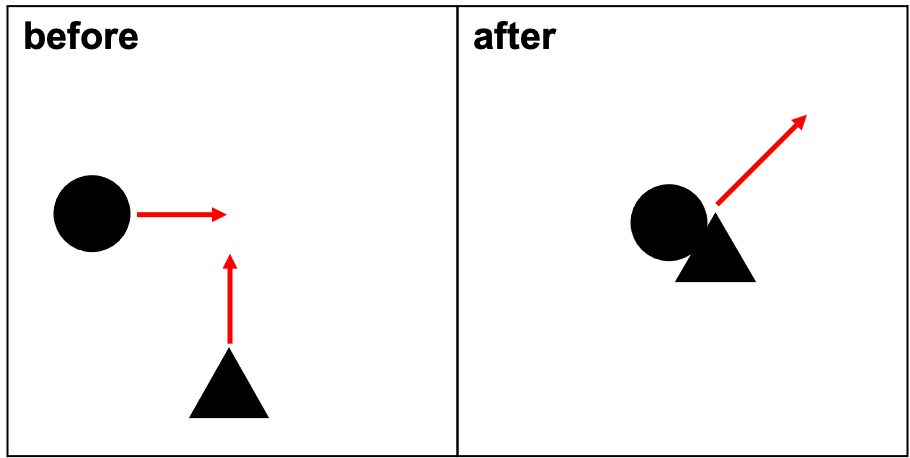
If the circle and triangle in Figure 6.6 both have a mass of 1 kg, the circle has a velocity of (1 m/s, 0 m/s), and the triangle has a velocity of (0 m/s, 1 m/s), then the momentum of the circle is (1 kgm/s, 0 kgm/s) and the momentum of the triangle is (0 kgm/s, 1 kgm/s). The total momentum of the system (both before and after the collision) is (1 kgm/s, 1 kgm/s). The magnitude of the total momentum can be calculated using the Pythagorean theorem as 1.41 kgm/s.
If the circle were to have more momentum than the triangle (say, by having a greater speed or greater mass), then after the collision, the system will have more rightward motion than upward motion. If instead the triangle were to have more momentum than the circle, then after the collision, the system will have more upward motion than rightward motion.
Engineering safer collisions
Based on what we’ve learned in this lecture, we can find a way to engineer a safer collision. We’ve seen that the momentum of an object is going to create an impact force on an object when it collides. We’ve also learned that the change in momentum (impulse) of an object is equal to force times time.
We want to have safe collisions in cases when we’re driving a car, or riding a bike, or any other situation where we could be injured when we collide with an object. In these scenarios, we want the force to be as minimal as possible in the collision. Because when we get into a collision, we’re unable to change our mass, our vehicle’s mass, or our velocity at the moment of the collision, and because we’re going to come to a complete stop after the collision, the initial momentum, final momentum, and therefore impulse are going to be fixed. We’d ideally like the number to be small, but we can’t control it after the fact. Because we know that impulse is equal to force times time, and we want the force to be as small as possible, we can see mathematically that extending the duration of a collision, which has the result of making a large number, will cause the force to be small, given that impulse is fixed.
The video below demonstrates the effect of time on the force generated to cause a fragile object to stop once it’s in motion. First, Dr. Pasquale throws an egg in such a way that the force acting on the egg is as small as possible. She throws the egg at a sheet, and the egg doesn’t break. The time duration of the collision is extended for a long period of time and therefore the force is small enough for the egg not to break. (In this way, the sheet acts like an airbag in a car.)
Then, Dr. Pasquale throws the egg so that its motion will be stopped very quickly. By throwing it at a wall, the duration of the collision is very fast, the force is very large and the egg shell cracks and makes a giant mess.
This is why cars are engineered to have crumple zones and air bags. Anything we can do to increase the time of a collision in the case of a car crash, for example, will reduce the stopping force on the occupants of the car and keep them as safe as possible.
Further reading
- Car safety rating search: National Highway Traffic Safety Administration – This website allows you to search for your car by make and model to see how “crashworthy” it is.
- Understanding Car Crashes: It’s Basic Physics – This YouTube video demonstrates the physics of car crashes, and why features such as airbags and seatbelts are important for traffic safety.
Practice questions
Conceptual comprehension
- Show that the unit of Ns is equivalent to the unit of kgm/s.
Numerical analysis
- A car with a mass of 1,200 kg is traveling at a velocity of 20 m/s. Calculate its momentum.
- A soccer ball with a mass of 0.45 kg is kicked with a velocity of 10 m/s. If it comes to a stop in 2 seconds, calculate the change in momentum of the soccer ball.
- A tennis player hits a 0.05 kg tennis ball with a force of 100 N, changing its velocity from 15 m/s to -10 m/s. Calculate the impulse applied to the tennis ball.
- Two cars, A and B, have masses of 1,200 kg and 800 kg, respectively. Car A is moving at 15 m/s to the right, and car B is moving at 10 m/s to the left. They collide and stick together. Calculate…
- …the initial momentum of the system.
- …the final momentum of the system.
- …the final velocity of both cars.
- Was this an inelastic or elastic collision? How do you know?
- Suppose you have a 0.2 kg hockey puck initially at rest on an ice rink. It is then struck by a 0.3 kg hockey puck moving at 5 m/s to the right. After the collision, the two pucks travel together. Calculate…
- …the initial momentum of the system.
- …the final momentum of the system.
- …the final velocity of both hockey pucks.
- Was this an inelastic or elastic collision? How do you know?
- Two cars, C1 and C2, have masses of 1,200 kg and 900 kg, respectively. Car C1 is moving at 20 m/s to the right, and car C2 is moving at 10 m/s to the left. After the collision, car C1 has a velocity of 6 m/s to the left, and car C2 has an unknown velocity. Calculate…
- …the initial momentum of the system.
- …the final momentum of the system.
- …the final velocity of car C2.
- A car with a mass of 1,500 kg collides with a brick wall at an initial speed of 40 m/s, coming to a stop in 0.5 seconds. Calculate the magnitude of the force of the collision.
- If the car above instead collides with a bale of hay, slowing from 40 m/s to a stop in 4 seconds, calculate the magnitude of the force of the collision.
Hands-on experiments
- If you have a smartphone, download a free sensor app such as phyphox or Physics Toolbox Sensor Suite. Using the acceleration selection, jump up and down and notice that there is an acceleration on the phone generated when you jump while holding the phone. (From Newton’s second law, we know that acceleration and force are directly proportional.) Jump up and down and land with bent knees (extending the time of impact as much as possible) and compare the acceleration in that case to jumping up and down and landing with straight knees (minimizing the time of impact). Try to control for as many other variables as possible. How does the time of your collision with the ground relate to the force generated?
Momentum is a vector property that quantifies the motion of an object. It is sometimes called "inertia in motion" as it is the product of mass and velocity. (symbol: p, unit: kgm/s or Ns)
A vector quantity is a variable that must be conveyed with both a numerical quantity (indicating magnitude or strength) and a direction.
Mass is a property of physical objects that relates to resistance to changes in motion: inertia. (symbol: m, unit: kg)
Velocity is the vector quantity that describes the rate at which an object changes its position. Velocity is equal to displacement divided by time. (symbol: v, unit: m/s)
A force is a push or a pull that causes an object to change its motion. More fundamentally, force is an interaction between two objects. (symbol: F, unit: N)
Speed is the scalar quantity that describes the rate at which an object changes its position. Speed is equal to position divided by time. (symbols: s, |v|, unit: m/s)
Impulse is the measure of the change in momentum of an object or of a system of objects. (symbol: Δp, unit: kgm/s or Ns)
A system is any collection of objects that we define. The concept of a system is used to determine what is internal or external when discussing concepts such as momentum conservation.
Newton's third law states that for every action, there is an equal and opposite reaction. All forces exist in action-reaction pairs that are equal in magnitude and opposite in direction.
The net force is the vector sum of all forces acting on an object.
In an inelastic collision, there is either lasting deformation of the objects in the collision, or heat/sound generated during the collision (or both). In an inelastic collision, momentum is conserved, but kinetic energy is not (as it is converted to other forms of energy during the collision).
Heat is energy that is transferred from one object to another in response to a difference in temperature. (symbol: Q, unit: cal)
In a perfectly inelastic collision, the maximum amount of kinetic energy is lost in a collision. In a perfectly inelastic collision between two objects, the two objects will travel together after the collision.
An elastic collision occurs when there is neither lasting deformation of objects in the collision, nor generation of heat during the collision. Both momentum and kinetic energy are conserved in elastic collisions.

.jpg)