20. Sound
Summary
Sound waves
Sound waves are longitudinal waves that are caused by variations in air pressure between two points. Because sound waves are caused by pressure disturbances, they require a medium to travel through.
Speakers turn an electrical signal into vibrations. In the video below, Dr. Pasquale placed some small pieces of paper on top of a speaker, whose membrane vibrates back and forth. The frequency of the source controls how quickly these vibrations occur. At low frequencies, it is easy to see the pieces of paper moved around by the vibrations.
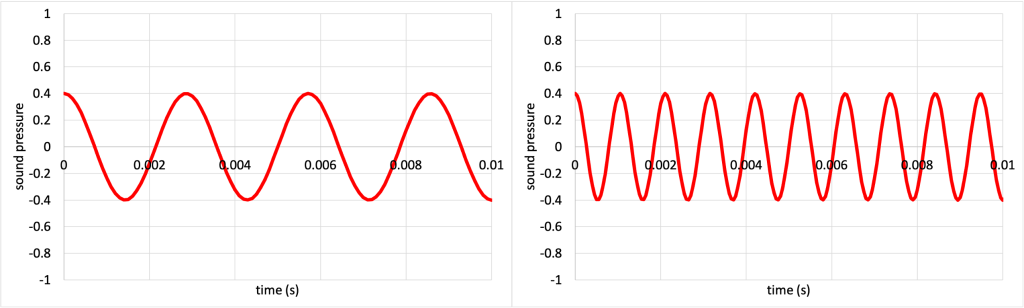
The frequency of a sound wave controls the pitch of that wave. In the video below, Dr. Pasquale has a sound source that creates a continuous tone of sound. In increments, she increases the frequency of the sound source. As the frequency increases, the pitch of the tone increases as well. In the demo, Dr. Pasquale used a microphone to capture the sound wave vibrations and show the pressure vs. time graph for the waves. As the frequency of the sound source increases, you can see the oscillations occur more and more frequently as the frequency increases. It is important to note that sound waves are longitudinal. The waves on these graphs appear as sine waves because they show the variation in pressure over time, not the actual vibrations in the air moving back and forth longitudinally.
The pressure vs. time graph for a low frequency (left) and high frequency (right) sound wave from the video are shown in Figure 20.1.
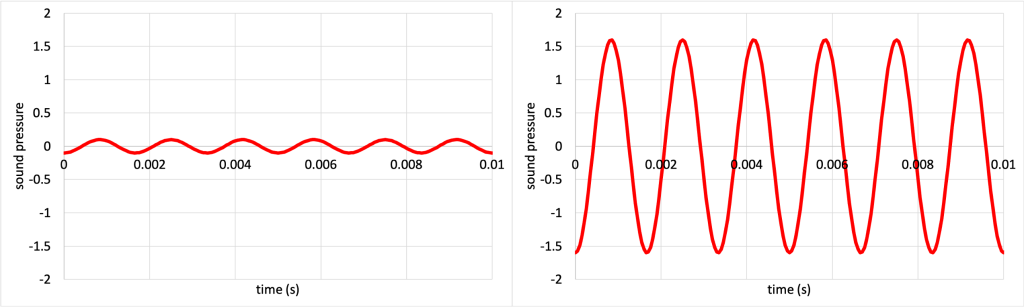
The amplitude of a sound wave is proportional to the loudness, or volume, of that wave. In the video below, Dr. Pasquale uses a sound source that creates a continuous tone of sound. The frequency is kept constant, but the amplitude is increased for the first half of the video, then decreased for the second half of the video. As the amplitude increases, volume increases, and vice versa. The pressure vs. time graph shows the amplitude changing over time as the sound source is changed.
The pressure vs. time graph for a small amplitude (left) and large amplitude (right) sound wave from the video are shown in Figure 20.2.
Musical instruments
Musical instruments work by creating vibrations: sound waves. Different types of instruments create sound waves differently: by creating a vibration in a string, by blowing air across a reed or a mouthpiece, or by creating vibrations on a membrane stretched over a drum. The quality of the sound waves, known as timbre (pronounced TAM-ber), is produced by the materials, design, and quality of the instrument itself.
Large instruments (such as a tuba or a bass violin) are capable of supporting standing waves with a large wavelength. Small instruments (such as a piccolo or kazoo) support standing waves with small wavelengths. Figure 20.3 shows people playing large brass instruments (left) and a piccolo (right) for scale.
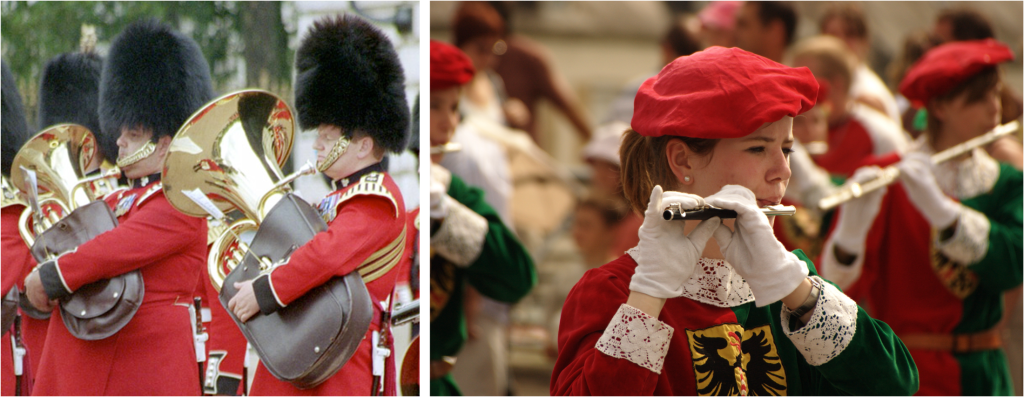
Because of the relationship between frequency, wavelength, and wave speed, large instruments will create sound waves with low frequencies, and small instruments will create sound waves with high frequencies. This explains why large instruments create low-pitched sounds and why small instruments create high-pitched sounds.
Range of human hearing
Humans are capable of hearing sounds that range from very low pitch to very high pitch. Our range of hearing is approximately 20 Hz to 20,000 Hz. This of course varies from person to person, and changes as we age. Starting around 30 years old, the higher range of our hearing tends to degrade. This means that the older you are, the lower the frequency of your upper range of hearing will be. That means a high-pitched noise that bothers a young person may not even be audible to an adult.
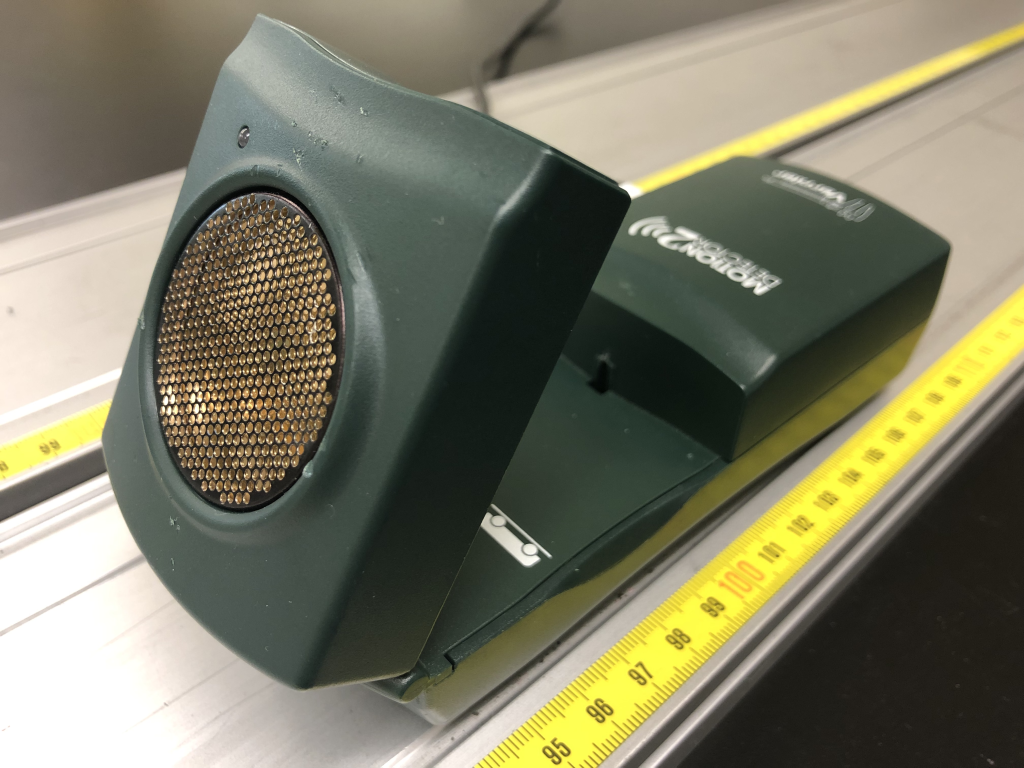
Sound waves that have frequencies above 20,000 Hz are known as ultrasonic. Ultrasound is used in many applications in our lives. The motion detectors (Figure 20.4) that have been used to create many of the video demonstrations in this textbook use an ultrasonic wave that reflects off the nearest surface and bounces back to the detector. Ultrasound is also used frequently in medical diagnostics and imaging.
Sound waves that have frequencies below 20 Hz are known as infrasonic. Many natural sources such as earthquakes, volcanoes, and waterfalls emit infrasound. Infrasound detectors can therefore be used to monitor these phenomena.
The speed of sound
How fast do sound waves travel? That’s a simple question with a somewhat complicated answer. Because sound waves are pressure vibrations that move through a medium, the speed that those vibrations move is dependent on the medium. Lots of things can affect the speed of sound.
First, consider what happens to the speed of sound in different phases of matter. Sound waves travel when molecules bump into each other, transmitting energy from one place to another. If molecules are more rigid and spaced more closely together, then the speed of sound will be faster than if molecules are loosely connected and spaced far apart. This means that sound travels fastest through solids, where molecules are tightly packed, and most slowly through gases, where molecules are very far apart. The speed of sound through a liquid will be somewhere in between. Sound waves will not travel at all through a vacuum, as there are no molecules present to cause pressure vibrations.
Most of the time, humans experience sound waves as they move through air: a gas. So what is the speed of sound in air? There is no one answer to this question. The biggest factor that influences the speed of sound in air is the temperature. To a small degree, things such as humidity and wind speed can affect the speed of sound as well.
It is possible to use an equation to determine the speed of sound in air. This equation was experimentally derived, and air temperature is the independent variable. The equation states that the speed of sound at a given temperature is equal to

where  is the air temperature in degrees Celsius.
Room temperature is approximately 20 oC. Using the equation to determine the speed of sound at that temperature:

The speed of sound is much, much slower than the speed of light. This is why we may see things that are far away and notice that the sound of the object is out of sync with what we see. For example, somebody playing basketball may dribble the ball, and the sound of the ball bouncing off of the ground will reach our ears after the ball actually bounces. The farther away something is, the more pronounced the effect will be.
Note that the speed of sound does not depend on the properties of the wave itself: frequency and amplitude do not affect the speed of sound. If you speak louder or softer, that does not change how long it will take the sound of your voice to reach a point a fixed distance away.
Reflection and refraction
When waves travel, they can change their motion and properties in different ways. One thing that can happen with waves is called reflection. This occurs when waves bounce off of a surface. If you’ve looked in a mirror, you’ve experienced the reflection of light waves. Sound waves can reflect as well. When discussing sound waves, a reflection is sometimes called an echo, especially when a sound wave reflects off of a surface that is far away, causing a delay between the initial sound source and the reflected wave.
The reflection of ultrasonic waves is frequently used to determine the distance between two objects.If the temperature is known, the speed of sound can be calculated, thus distance can be determined by using the velocity equals distance divided by time equation. The time will be how long it takes for a wave to leave an ultrasonic sensor, bounce off of an object, and return to the sensor. In fact, this is how the motion sensor shown in Figure 20.4 operates.
It is also possible for sound waves to refract, or bend. This happens when the speed of sound changes, for example, if there is a big temperature difference that a sound wave travels through. We will discuss the concept of refraction in more detail later in this textbook in the context of light waves.
Interference and beats
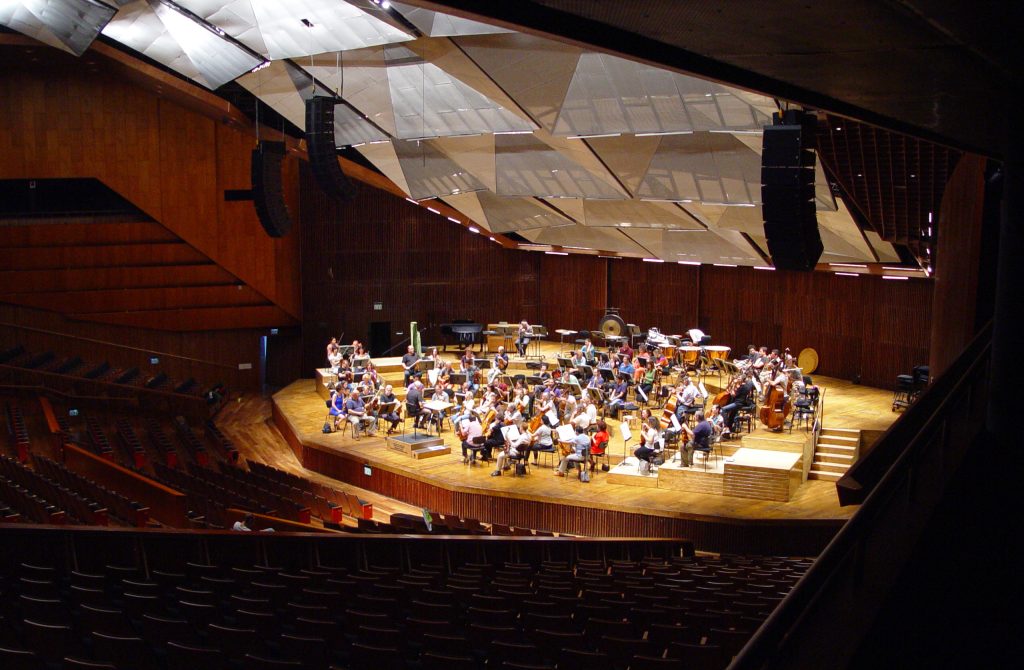
Like any other waves, sound waves can interfere. This can cause strange things to happen acoustically when sound waves reflect off of surfaces, say, in a concert hall. It’s possible that waves can constructively and destructively interfere in ways that cause an orchestra or band to sound less than ideal at certain positions in a concert hall. Acoustic spaces such as concert halls are usually designed with strangely shaped panels designed to randomly reflect sound waves to reduce the bad-sounding consequences of interference so that members of the audience can enjoy the sounds of the music. An example of acoustic tiles in a concert hall are shown in Figure 20.5.
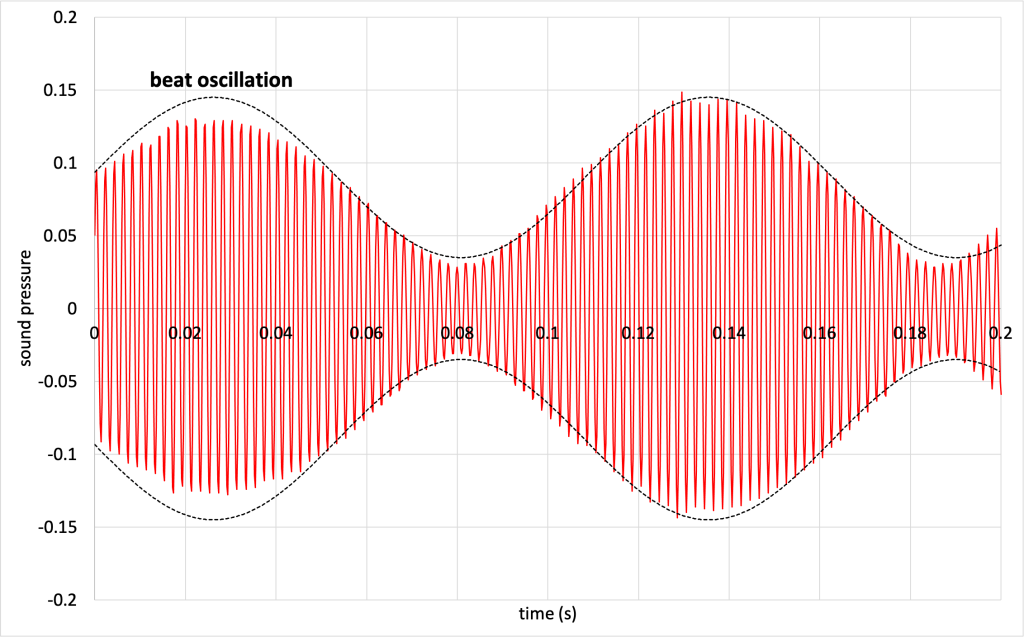
The interference of sound waves leads to another effect: beats. Beats occur when two sound waves of very similar frequency interfere with each other. This interference creates an interesting wave that has an amplitude that increases and decreases, and sounds like a regular increase and decrease in the volume of that sound. As the frequencies of two interfering waves become closer together, our ears eventually begin hearing the two different pitches together as a single musical tone.
In the video below, Dr. Pasquale turns on two sound sources at frequencies of 480 Hz and 489 Hz. Perhaps you can hear the sound of the beat, which comes across as an increase and decrease in the sound of the tones.
The sound pressure of the sound waves was recorded using a microphone. When both pure tones play at the same time, the graph, as shown in Figure 20.6, shows a very fast oscillation (which has a frequency close to that of the pure tones, represented by a red line in Figure 20.6) superimposed with a slow oscillation (represented by a black dashed line in Figure 20.6). (Download this data [XLSX, 49 kB]) That slow oscillation is the beat oscillation and is caused by the interference of the two waves.
The frequency of a beat can be calculated using an equation. The frequency of the beat is equal to the absolute value of one frequency subtracted from the other. In equation form:

In the case of the audio example from the video above, the two tones have frequencies of  = 489 Hz and
  = 480 Hz. Therefore, the beat frequency is 9 Hz.
Forced vibration and resonance
Striking a tuning fork with a mallet causes it to vibrate. There is energy in these vibrations. In the video below, Dr. Pasquale strikes a tuning fork, then places the vibrating tuning fork into a beaker of water. The water splashes out of the beaker, which is a great visual indication of the energy stored in the tuning fork after it was forced to vibrate.
A forced vibration occurs when one object causes another object to vibrate at a certain frequency. In the video below, Dr. Pasquale strikes a tuning fork to get it to vibrate. Then she places the tuning fork on a table, which causes the table to vibrate at the same frequency as the tuning fork.
Plucking a guitar string causes the body of the guitar to vibrate as well, providing another example of forced vibration. This occurs in many musical instruments.
On the other hand, the natural frequency of an object refers to the frequency of the sound wave that object will tend to produce. A tuning fork is a device built to have a natural frequency that is a pure tone which can be generated by striking the tuning fork with a mallet. This tone comes from the vibrations of the tines of the fork, with smaller tuning fork tines generating higher pitched sounds than larger tuning fork tines. A collection of tuning forks of different sizes is shown in Figure 20.7.
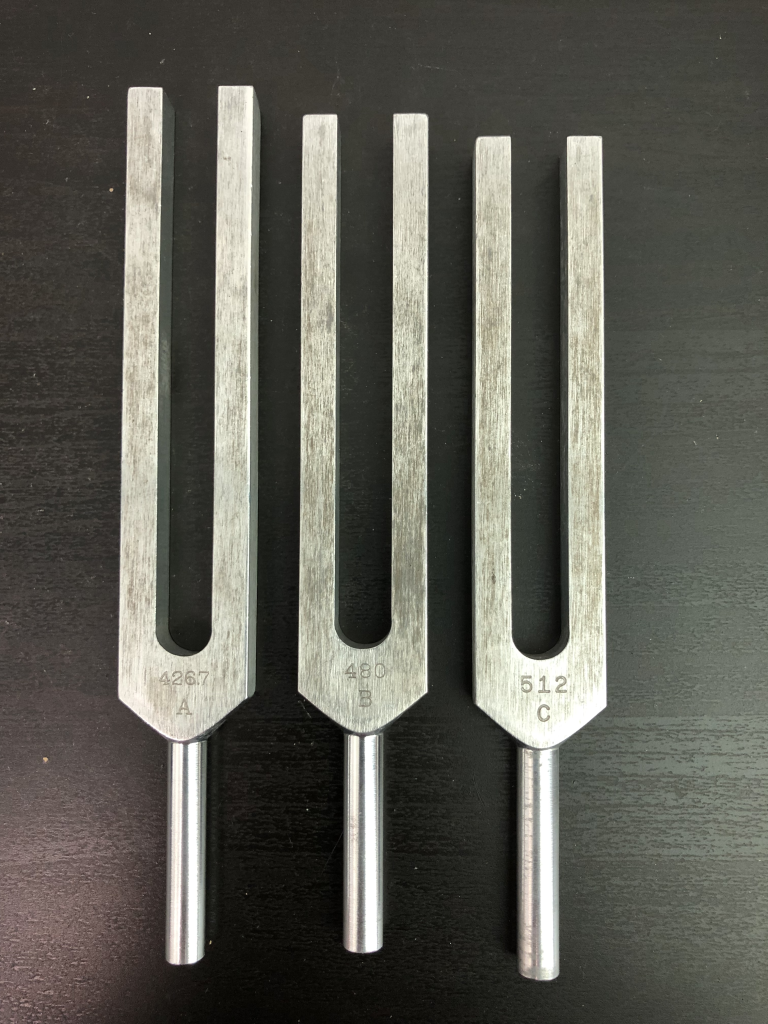
In the video below, Dr. Pasquale strikes three different tuning forks, demonstrating that the frequency (pitch) of the tones generated by the tuning forks is related to the length of the tines.
If an object is forced to vibrate at its natural frequency, that phenomenon is known as resonance. One example of this can be demonstrated by swinging on a swing set. If you pump your legs at the natural frequency, then the amplitude of your swing will increase. Simply pushing the swing at the same frequency of its oscillation will cause the amplitude of the swing to increase (shown in the video below), an example of resonance.
In the video below, Dr. Pasquale demonstrates resonance using an apparatus that contains two sets of three pendulums (each with different lengths) that are connected by a tube. When Dr. Pasquale gets the largest pendulum swinging, it moves back and forth at its natural frequency. That vibration travels through the tube and excites the identical pendulum on the other side, causing it to move back and forth as well. This forced vibration from the left-hand pendulum is equal to the natural frequency of the right-hand pendulum, so resonance occurs and both pendulums continue to move. The two smaller pendulums also experience that forced vibration, but do not start to move because they have different natural frequencies.
Dr. Pasquale then repeats this experiment by moving the middle pendulum, which causes the middle pendulum to oscillate on the other side. The same phenomenon happens with the small pendulum. Resonance occurs when the forced vibration is equal to the natural frequency of the object.
Standing waves also demonstrate the phenomenon of resonance. This can occur in any system that can oscillate: the coiled rope used to show standing waves in chapter 19 of this book, the strings or cavities of a musical instrument, our vocal chords, and even a standing wave excited in a glass bottle, demonstrated in the video below.
Resonance is a phenomenon that is also seen in other physical properties, not just sound. Lasers use optical resonance to create strong beams of coherent light. Electric circuits use resonance to tune to particular radio or television stations.
Resonance can be used in many beneficial applications. However, because resonance leads to an amplification of energy, we must be cautious. If energy is left to amplify too much, the energy build-up within the object undergoing resonance may eventually cause it to break apart. If an object such as a bridge or structure is caused to vibrate at its resonant frequency, it may collapse. Engineers take this into consideration when designing buildings, bridges, airplanes, and other structures.
Further reading
- Resonance – This 30-minute video from The Mechanical Universe series demonstrates the concept of resonance using the notable Tacoma Narrows Bridge disaster. (Note: there is some consensus by experts that resonance was not the cause of the Tacoma Narrows Bridge disaster, but instead a concept called aeroelastic flutter, which is too complicated to discuss in this textbook. That said, this video is still very interesting and has lots of good scientific information about resonance.)
- Acoustic levitation – Styrofoam beads are levitated in the interference patterns created in sound waves.
- Hearing ranges – This Wikipedia article discusses the hearing ranges of a wide variety of animals, including humans.
Practice questions
Numerical analysis
- Calculate the speed of sound in air at…
- …0 oC.
- …-30 oC.
- …40 oC.
- A student measures the speed of sound in a lab and finds it to be 341 m/s. Calculate the temperature of the lab.
- A student measures the speed of sound as it travels in an oven and finds it to be 522 m/s. Calculate the temperature of the oven.
- Two tuning forks produce sound waves with frequencies of 450 Hz and 452 Hz. Calculate the beat frequency when both pure tones are played at the same time.
- If two speakers emit sound waves at frequencies of 680 Hz and 685 Hz simultaneously, calculate the beat frequency heard by an observer standing nearby.
- A musician plucks two guitar strings simultaneously. One string has a frequency of 250 Hz, and the beat frequency is 6 Hz. Calculate the two possible frequencies that could be generated by the other guitar string.
Hands-on experiments
- Create a rubber band guitar by stretching a rubber band over the top of an empty tissue box or a cardboard tube. Pluck the rubber band and observe how the pitch changes when you stretch the rubber band tighter.
- Fill several glasses with different amounts of water (alternatively, use a single glass and add to or remove water from it). Gently tap the glass(es) with a spoon and observe how the pitch changes with the amount of water. Does the pitch increase or decrease when the water level is closer to the top of the glass?
- Make a drum. Find a container with an opening on the top, like a plastic container or an aluminum can. Stretch a balloon over the open end and secure it with a rubber band. Tap the balloon and observe the different sounds you can create by varying the tension on the balloon.
A sound wave is a longitudinal wave that is caused by vibrations in air pressure between two points.
In a longitudinal wave, the oscillations of the wave travel in the same direction as the wave itself.
Pressure defines the amount of force applied over an area of a substance. (symbol: P, unit: Pa)
A vibration is a periodic back-and-forth motion that remains fixed in one location.
Frequency describes how many oscillations occur per second in a wave. (symbol: f, unit: Hz)
Wave amplitude describes the maximum displacement from either side of the equilibrium position.
Loudness has to do with the subjective quality of the amplitude of a sound wave.
The timbre of a sound wave describes the qualities of that wave that make it distinct from other sound waves that have the same frequency and amplitude.
A standing wave is a wave that oscillates in time but that does not move in space. Standing waves occur due to interference between two waves that have equal amplitude and frequency that travel in opposite directions.
The wavelength of a wave describes the shortest distance between two identical repeating points on a wave. (symbol: λ, unit: m)
Speed is the scalar quantity that describes the rate at which an object changes its position. Speed is equal to position divided by time. (symbols: s, |v|, unit: m/s)
Ultrasound is the set of sound waves that have frequencies above 20,000 Hz. They are not audible to humans.
Infrasound is the set of sound waves that have frequencies below 20 Hz. They are not audible to humans.
Energy is defined as the capability of an object (or collection of objects) to do useful work. (symbol: E, unit: J)
A solid is a substance where the molecules or atoms are very tightly bound together. This gives a solid a very rigid volume and shape. Solid is one of the four most common phases of matter.
Gas is a state of matter where molecules are very free to move about and generally do not interact with each other except during collisions. This means that the shape and volume of a gas is free to change. Gas is one of the four most common phases of matter.
A liquid is a state of matter in which the constituent molecules will change their shape or arrangement but cannot be easily compressed to change their volume. Liquid is one of the four most common phases of matter.
Temperature defines the average kinetic energy of an object. It quantifies the “hotness” or “coldness” of something. (symbol: T, unit: °C or K)
A wave is a periodic oscillation that transfers energy from one place to another.
Reflection occurs when a wave bounces off of a surface and subsequently changes its direction.
Velocity is the vector quantity that describes the rate at which an object changes its position. Velocity is equal to displacement divided by time. (symbol: v, unit: m/s)
Refraction occurs when a wave changes speed (and therefore bends) at an interface between two different media.
Interference is the phenomenon that occurs when two waves overlap. The total amount of wave energy present at a point is equal to the sum of each individual wave's energy at that point.
A beat is an interference phenomenon resulting from the time interference of two sound waves at very similar frequencies. It is perceived as a periodic change in amplitude of the composite wave.
A forced vibration occurs when one object causes another object to vibrate at a certain frequency.
The natural frequency of an object refers to the frequency that the object will tend to produce.
Resonance occurs when an object is forced to vibrate at its natural frequency, which could lead to vibrations of increasing amplitude.
Coherent light means that all of the waves have the same frequency and phase.
A circuit is an interconnection of elements such as batteries, light bulbs, resistors, capacitors, and diodes.
