16. Heat transfer
Summary
Conduction
Conduction is heat transfer that occurs due to physical contact between objects. Conduction also explains how heat is able to transfer within an object.
As discussed in the previous chapter, temperature relates to the average energy of molecules. If molecules are able to easily bump into each other, causing collisions that transfer energy from one place to the next, then those types of substances will be good conductors of heat. Good heat conductors tend to be solids, where molecules are in close physical proximity. In liquids (where the molecules are not rigidly bonded to each other) and gases (where molecules are spread farther apart), it’s harder for heat to conduct due to these atomic collisions.
In fact, the solid objects that make the best heat conductors tend to be those that also make the best electrical conductors: metals. In metals, electrons are capable of moving around readily, which provides for a very efficient transfer of thermal energy from one part of a metal to another.
In the video below, there are two pretty much identical ice cubes that have been placed onto different black plates. One of the plates is metal and the other one is foam. Metal is a good heat conductor. Foam is not a good heat conductor. Therefore, the metal is able to conduct heat from the surrounding air into the metal plate, and thus into the ice cube, very efficiently. That ice cube melts very rapidly.
On the other hand, the foam plate is a poor heat conductor (alternatively: it is a good thermal insulator). That means that it keeps the heat in the atmosphere away from the ice cube, and that ice cube barely melts at all. Note that both ice cubes are surrounded on five sides by air. Air, being a gas, is a rather poor heat conductor. When the ice cube on the metal plate melts, it melts predominantly from the bottom, the side that is in contact with the good heat conductor.
This demonstration also explains why metal objects tend to feel cold to the touch even when they are at the same temperature as their surroundings. When you touch something metal, that metal is able to conduct the heat from your hand away very readily. Similarly, objects made of bad heat conductors, things like plastic, wood, paper, cork, and other insulators, are not going to feel cold to the touch, unless they themselves are cold.
Even among metals, thermal conductivity can vary. In the video below, there is an apparatus with four different metals that connect to a central plate. Dr. Pasquale places candles into each of the metals then lights a Bunsen burner under the central plate. As that central plate heats up, it conducts heat to each of the four metals. The metal that heats up the fastest has the highest heat conduction, and will melt the candles fastest.
First, you can see that the heat is going to travel outward. That is to say, the candles closest to the central plate melt first. Second, you can see that the best heat conductor melts the candles the fastest.
That best heat conductor is copper, which contains all of the green candles. The next best heat conductor is aluminum, which contains all of the yellow candles. Then comes brass, with the blue candles. Finally, the worst of the heat conductors of these four metals is iron, which has the red candles.
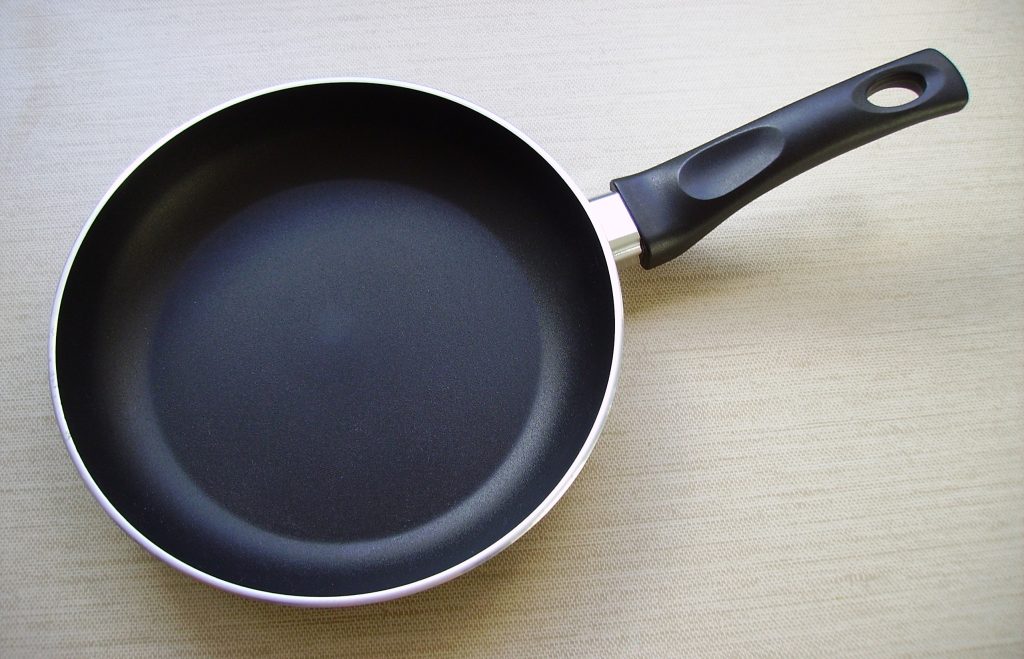
Remember, heat conduction requires physical contact between materials, or within a material. When you put food onto a frying pan to cook it, that food will cook due to that physical contact: heat conduction. This is why frying pans are made out of metals: they are good heat conductors! The part of the frying pan we have to touch is frequently covered with plastic or is very long and far away from the center of the frying pan, keeping our hands safe from the heat of the stove. The frying pan in Figure 16.1 has a metal base and a plastic handle.
One last thing about heat conduction: don’t confuse heat conduction with specific heat capacity! While they seem similar, they are actually two completely different things. Heat conduction quantifies the ability of a material to allow thermal energy to move through it from one place to another. Specific heat capacity quantifies how much heat is required to change the temperature of a certain amount of material.
Convection
Convection is heat transfer that comes about due to the motion of molecules themselves. The types of materials that are good at convection are the types of materials where molecules can move around very freely: liquids and gases.
If you’ve ever held your hands above a toaster while heating something up, you’ve experienced convection. Air in close proximity to the toaster coils heats up. As that air heats up, it becomes less dense than the surrounding air, causing it to rise. When you hold your hand above the toaster, you are experiencing that warm air rising up.
In the video below, there is a large beaker filled with water that’s a little bit colder than room temperature. Dr. Pasquale places inside of that beaker a smaller flask filled with hot dyed water. The dye is just there to help visualize the motion of the molecules in that flask. What happens is that the hot water, being less dense than the surrounding cool water, is going to experience a buoyant force that causes it to rise up. You can see this from the dyed water moving upward in the beaker.
Eventually, as the hot water moves upward, it exchanges heat energy with the cool water, causing the cool water to increase its temperature and the hot water to decrease its temperature. This process repeats until the entire mixture reaches thermal equilibrium.
Convection occurs in our atmosphere all the time. On hot summer days, the ground is heated up by the Sun (in a process that will be discussed in the next section of this textbook). The air directly above the ground heats up due to conduction, and then the convection process causes that heat to rise up into the atmosphere. This causes a lot of vertical motion in the air.
This is why, in the summer, we tend to see a lot of cumulus clouds (Figure 16.2), which have a lot of vertical height to them. They occur when there is a lot of convection in the atmosphere. Atmospheric convection also causes turbulence in airplanes.

Convection doesn’t happen as much in the winter, because the ground doesn’t heat up as much when it’s covered in snow. Winter days tend to cause stratus clouds (Figure 16.3), which are very flat, indicating that there isn’t a lot of convection, or vertical motion, in the atmosphere.

Electromagnetic radiation
Electromagnetic radiation is heat that is transferred from one place to another through light waves. Heat from the Sun travels nearly 150 million km through the vacuum of space to our planet as light waves. When those light waves reach the surface of the Earth, objects on the Earth’s surface can absorb this energy and will heat up.
The amount that objects heat up has to do with how much of the light they absorb. Black objects absorb (almost) all of the visible wavelengths of light, which is why they appear to be black. This absorption makes black objects heat up much more readily than objects of a different color.
This may be something you experience if you have a dark-colored car. The Sun’s light is absorbed by the car, heating it up. This is very nice in cold weather, but can make it hard to cool the car down in hot weather. If you drive a white or silver car, it’s very likely you have the opposite experience. Your car remains cooler in hot weather, but does not heat up as much from the Sun’s rays in the cold.
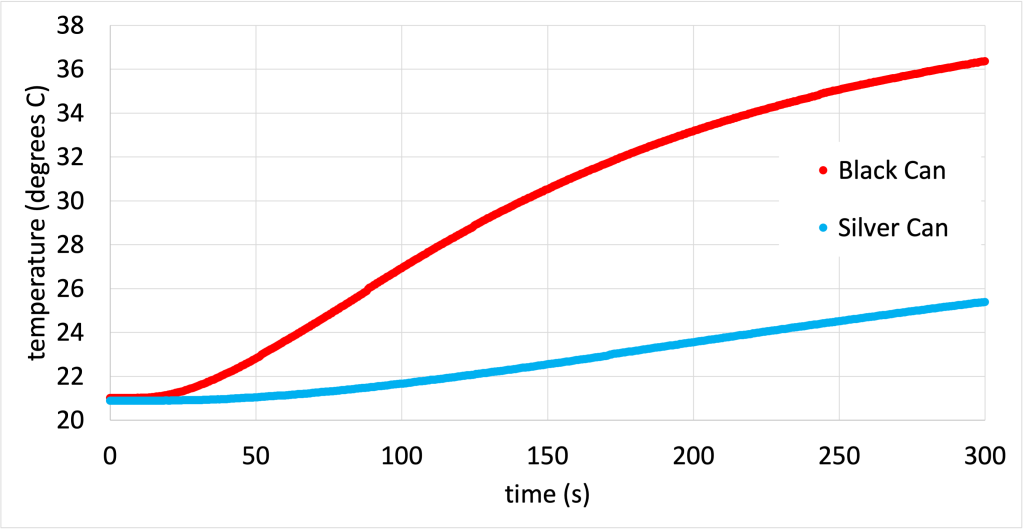
This is demonstrated in the video below. There are temperature probes placed in otherwise identical cans. The only difference between the two cans is that one is silver, and the other has been painted black. Dr. Pasquale connects the temperature probes to Logger Pro and turns on a heat lamp. The heat lamp is placed so that it was equidistant from both cans. Right away, the black can starts recording higher temperatures, indicating that it heats up more readily from electromagnetic radiation due to its color. The silver can heats up, but not as quickly.
The data from this demonstration (while the cans were heating up) is shown in Figure 16.4. (Download this data [XLSX, 47 kB])
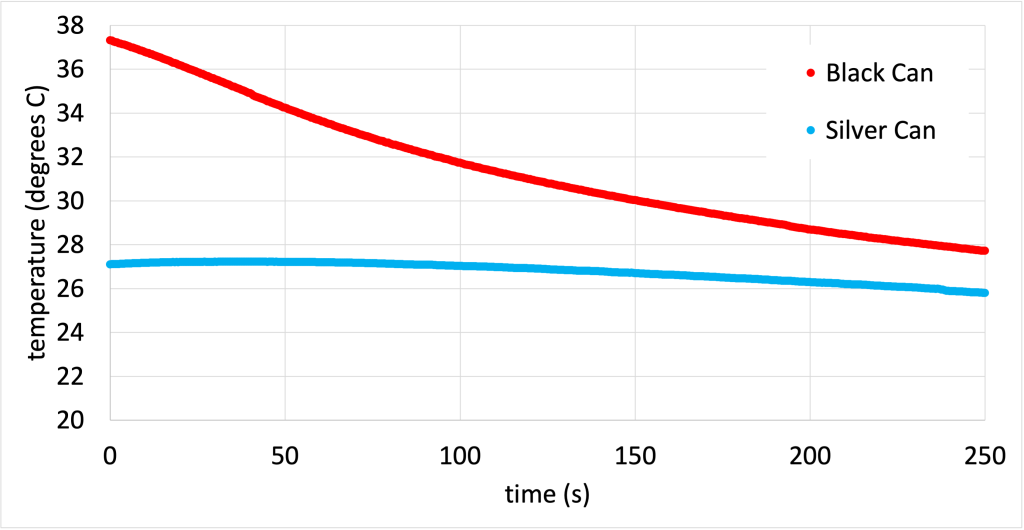
If a black object heats up faster, what can we say about how quickly it cools down? Dr. Pasquale removed the heat lamp and recorded the temperature of both cans as they cooled off. The black can not only heats up faster, but also cools down faster as well. The data from the experiment (while the cans were cooling down) is shown in Figure 16.5. (Download this data [XLSX, 31 kB])
The Sun is not the only object that emits electromagnetic radiation. In fact, when the cans from the video above cool down, they are re-emitting that electromagnetic radiation into the air and surrounding objects. Humans also absorb and emit electromagnetic radiation. The reason we don’t see it is that the wavelengths of light we emit are in the infrared. Infrared light is not something that the human eye is able to see.
If we use an infrared camera, we can collect infrared light that is emitted from different objects. Figure 16.6 shows an infrared photo of one of the College of DuPage physics classes from a few years ago. Notice that people, who are warm compared to the air, emit a good amount of infrared light, which is then collected by the camera.
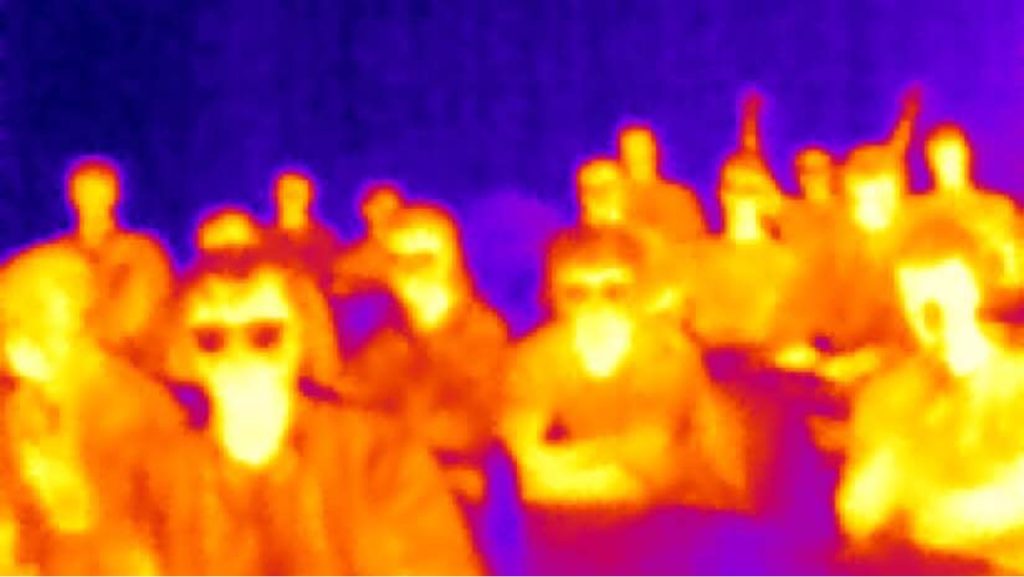
The students who wear glasses look like they have dark spots around their eyes. This is because glass does not allow infrared light to pass through it. It’s not that the students have cold eyes, it’s that the infrared radiation emitted by the student’s eyes is blocked from reaching the camera.
The hotter an object is, the higher the energy of the light that they will emit. Infrared has relatively low energy and is generally emitted from objects that are relatively cool, such as “room temperature” objects or humans. Things that are very hot, such as stars, are much hotter and emit higher energy light. Light with more energy than infrared is red light, then orange light, all the way through the visible spectrum to blue light and then ultraviolet. A blue star would therefore be much hotter than a red star. We’ll revisit these topics when we talk about electromagnetic waves and light emission later in this textbook.
In general, if an object absorbs more energy than it emits, its temperature will increase. If an object emits more energy than it absorbs, its temperature will go down.
The greenhouse effect
The greenhouse effect is a gradual warming process as heat is trapped by gases in the Earth’s atmosphere. In short, these gases are transparent to the higher energy light coming from the (hot) Sun. These same gases are opaque to the lower energy radiation emitted from the (cold) Earth. This is analogous to an actual greenhouse (Figure 16.7), which is a beneficial structure used to keep plants from dying off in cold weather. In the case of our planet acting as a greenhouse, warming up the atmosphere and contributing to global climate change, the greenhouse effect is decidedly less positive.

A greenhouse is generally a glass building filled with plants. Sunlight is able to enter into the greenhouse through the windows, and the heat from that light is absorbed by the plants. The plants will re-emit light. Because plants are relatively cool, they emit heat as infrared light. As seen in the infrared photo in Figure 16.6, infrared cannot transmit through glass. Instead, it gets reflected off of glass surfaces. This means that all of the heat from the plants is trapped inside the greenhouse, causing the greenhouse to stay warm even if the outside is cold.
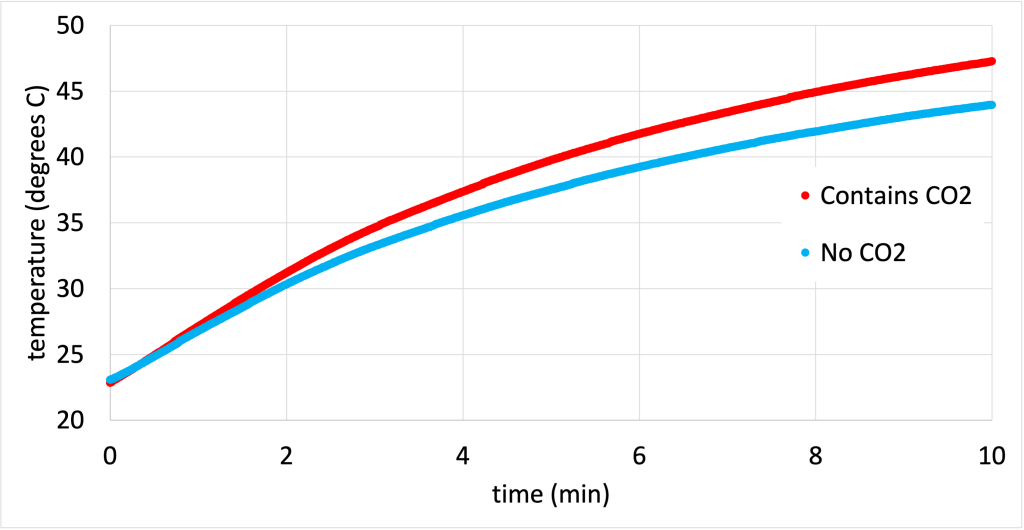
In the video below, two otherwise identical transparent plastic bottles have been placed at equal distances from a heat lamp. One of the plastic bottles has been filled with carbon dioxide, a greenhouse gas. As the heat lamp shines on both of the bottles, the temperature recorded by the computer shows that the bottle filled with carbon dioxide warms up much faster.
The temperature data recorded during this experiment is graphed in Figure 16.8. (Download this data [XLSX, 39 kB])
On our planet, the presence of greenhouse gases causes the re-radiation of electromagnetic radiation that would otherwise be lost if there were no greenhouse gases. This is shown in Figure 16.9.
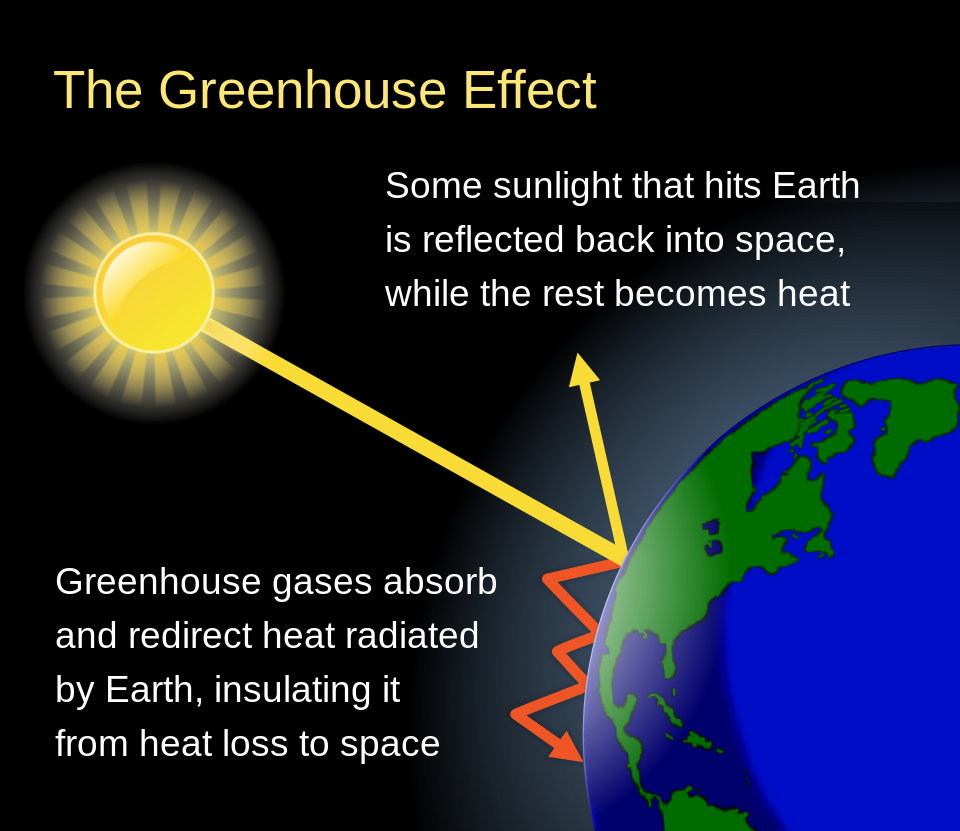
Globally, the greenhouse effect is an issue for our planet as our atmosphere contains a lot of carbon dioxide and other greenhouse gases that have accumulated in large quantities due to human activities. As our planet continues to warm up, this becomes a bigger and bigger problem.
To a certain extent, the fact that our planet is capable of trapping heat makes it possible for our planet to sustain life. However, when the atmosphere heats up to dangerous levels, we see catastrophic weather events. This is an area where technology and policy need to come together to create lasting change that will protect our planet and its inhabitants.
Engineering heat transfer
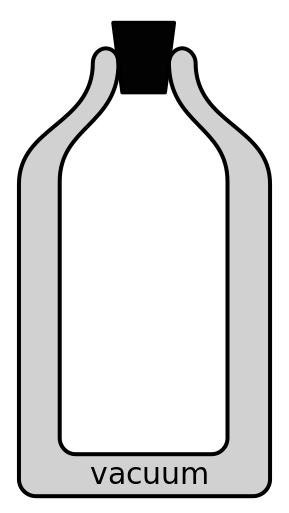
An insulated beverage container is a great example of how we can use the knowledge of heat transfer to engineer a container that can keep hot things hot and cold things cold. Insulated beverage containers are made from a double-walled material. Inside the two walls is a vacuum. The inside of the beverage container is silver in color. To keep things hot, or cold, we put a lid on top. (This is depicted in Figure 16.10.) How do all of those features keep our hot things hot and our cold things cold?
First, let’s answer the question of “how does an insulated beverage container know if something is hot, and should keep it hot, or if something is cold, and should keep it cold?” The answer is that those two concepts are identical. To keep something hot, we want to prevent heat from leaving the object. To keep something cold, we want to prevent heat from entering the object. Either way, we’re eliminating or reducing all opportunities for heat transfer to occur.
To eliminate or reduce heat conduction, the vacuum in the beverage container’s walls prevents heat from entering or leaving through the walls of the container. Gas in general is a bad heat conductor, and vacuum is incapable of conducting heat, as there are no molecules to collide in order to move heat around. The container lid is usually made of a heat insulator such as plastic or cork.
To eliminate or reduce convection, the vacuum between the beverage container’s walls is also incapable of convecting. Because there are no molecules in a vacuum, they cannot distribute heat by moving around. By placing a lid on the container, we are eliminating convection in the vertical direction by trapping heat inside the container.
Finally, the silver color of the interior of the beverage container greatly reduces heat transfer by electromagnetic radiation. Any heat inside the beverage container is going to reflect off the walls and stay inside. Any heat outside of the container is going to reflect off the walls and stay outside.
In the video below, Dr. Pasquale has placed hot water (90 degrees Celsius) into two different containers: a double-walled calorimeter with a lid, and a metal can (the same kind used on the inside of the calorimeter) without a lid. The calorimeter acts the most like an insulated beverage container. There are two silver cups surrounded by air (not a good heat conductor), and the plastic and cork lid prevents convection.
The data from this experiment is graphed in Figure 16.11. (Download this data [XLSX, 37 kB])
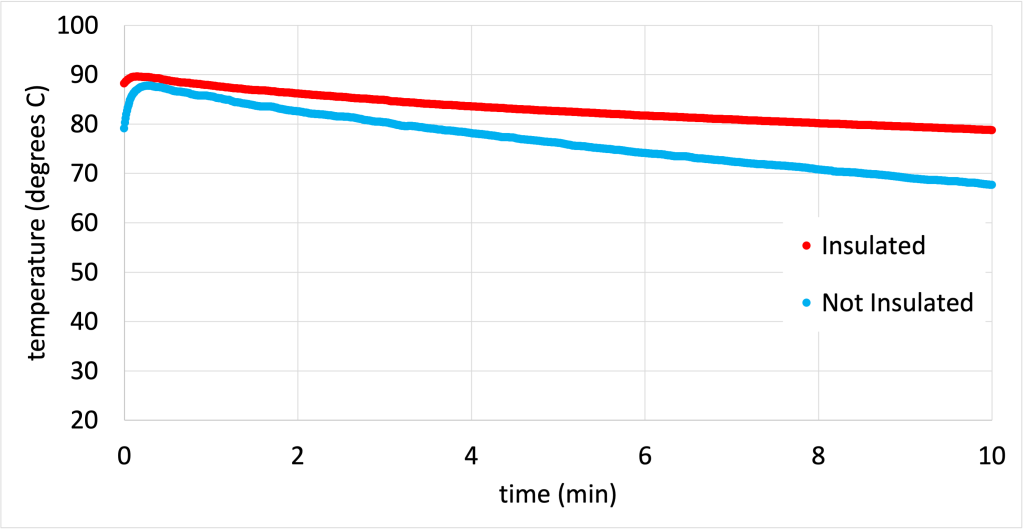
After placing the hot water into both containers, Dr. Pasquale recorded the temperature changes as they cooled down. Over a span of ten minutes, the double-walled calorimeter held heat much better than the open metal can did. Much of the heat in the metal can was lost due to convection. Even placing a lid on a pot, pan, or your favorite coffee mug will help keep your food and beverages warmer for a longer time.
Solar power
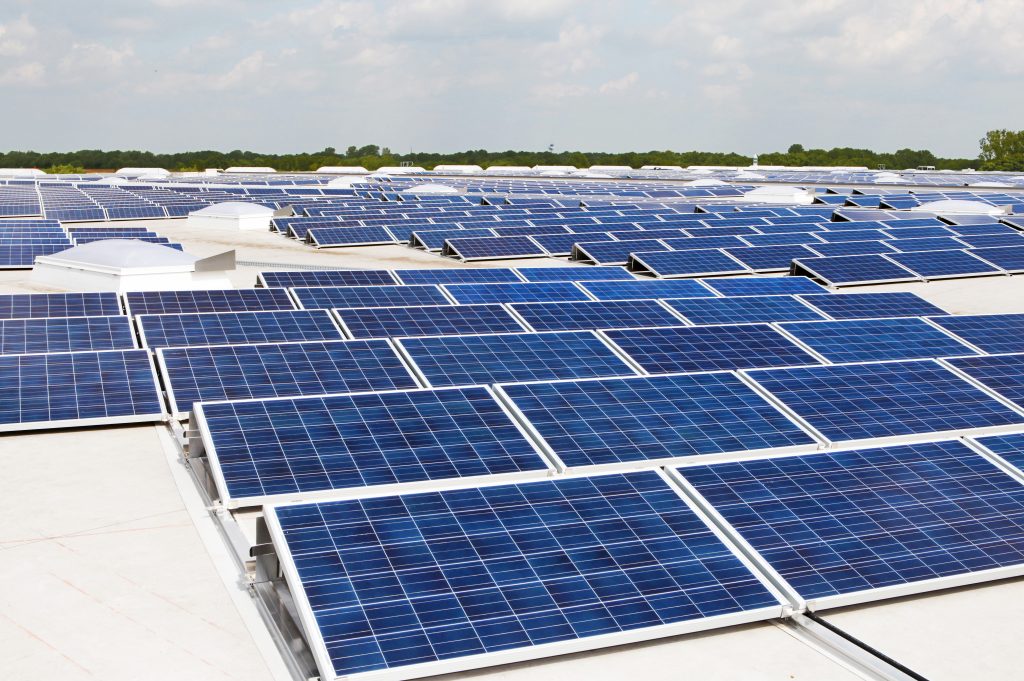
The Earth is constantly receiving energy from the Sun. Solar power can be used to generate electricity for use in our homes using a photovoltaic panel, known as a solar panel (Figure 16.12).
In the video below, a solar panel is connected to a light-emitting diode (LED). When no light is shining onto the solar panel, there is no electricity generated, and the LED remains off. Once Dr. Pasquale shines a flashlight onto the solar panel, electricity is generated and the LED turns on. This is a similar process to what happens when sunlight shines onto solar panels connected to a home or to the power grid.
The rate at which we obtain that energy is known as power: solar power. On average, the Sun transmits 1,400 J of energy every second to every square meter of the Earth that it hits. In other words, we receive 1,400 W/m2. This value is known as the solar constant.
If we consume a certain amount of power, we can use that information to determine how large of a solar panel we would need to generate that amount of electricity. To obtain enough power from solar panels, our power needs cannot exceed the power we receive from the Sun. In equation form, this can be stated as

where  is the average power consumption of our home and
  is the minimum area of the solar panels required to obtain that power from the Sun.
The amount of power we need depends on how much we run our appliances. On average, a household in the United States consumes 1,250 W of power in one day. If there are solar panels capable of taking the entire 1,400 W/m2 of power from the Sun to convert to usable electricity, then solar panels that are

would be sufficient to power that household. That size is not very big!
However, solar panels aren’t necessarily 100% efficient. A good solar panel is at best 15% efficient as of the time this textbook was written. How does this affect the size of the solar panels needed to power the average household? The solar constant of 1,400 W/m2 is now only converted at 15%, meaning that the solar panels will only create 210 W/m2 of power. In this case, the size of the solar panels required will be

This is a big difference from perfectly efficient solar panels! Making solar panels more efficient is a big topic in engineering and physics research. More efficient solar panels will make renewable energy much more competitive with fossil fuels, and more convenient.
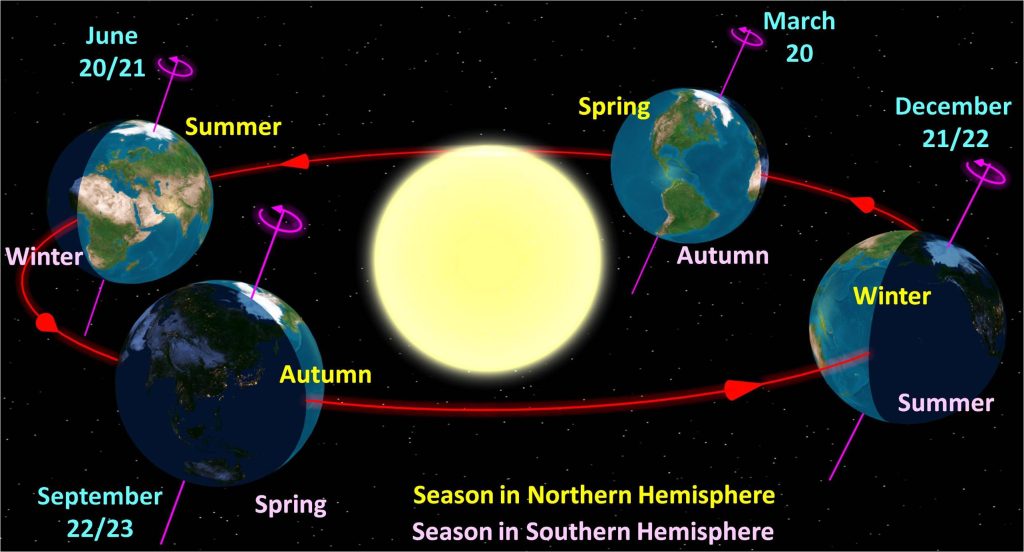
Another factor we must consider, if we do not live at the equator, is that the amount of energy we receive from the Sun is going to change throughout the seasons. This is because the Sun does not necessarily hit all parts of the surface of the Earth at a direct 90 degree angle. The equator may receive that 90 degree light, which means that area will receive more solar power than areas of the Earth that are tilted away from the Sun.
In the northern hemisphere in summer, the Earth’s axis is tilted toward the Sun, providing us with more direct light. We therefore obtain more energy from the Sun, and the northern hemisphere climate warms up, giving us hot summers. In the winter, the Earth’s axis is tilted away from the Sun, providing us with less direct light. We obtain less energy from the Sun per square meter, and the northern hemisphere climate cools down, giving us cold winters.
A graphic depicting the seasonal variations in the northern and southern hemispheres due to the Earth’s tilt relative to its orbit around the Sun is shown in Figure 16.13.
Newton’s law of cooling
Newton’s law of cooling defines the rate at which an object loses heat, or cools down. It states that the change in temperature over time,  (capital T for temperature) divided by
  (lowercase t for time), is proportional to the temperature of an object minus the temperature of the surroundings. In other words:

That means when there’s a big temperature difference between an object and its surroundings, we will expect it to cool down quickly. But as it cools down, the temperature difference between the object and the surroundings decreases, causing the rate of cooling to decrease as well. This continues to decrease until the temperature of the object asymptotically reaches the temperature of the surroundings.
This type of relationship is known as a differential equation and is described by a function known as an exponential function. The mathematics behind this function is beyond the scope of this textbook. However, we will use the basics of Newton’s law of cooling to understand and interpret a graph of the cooling of an object.
In an experimental demonstration, Dr. Pasquale took water at an initial temperature of 94 oC and recorded the temperature change over time as it cooled down. The temperature of the room was also recorded at a constant value of 22.5 oC. The temperature recordings were measured for ten minutes.
After the experiment was completed, Dr. Pasquale used Logger Pro software to calculate the exponential equation that represented the data. This was used to extrapolate the data to see what trend would occur if the experiment had been performed for an entire hour. The experimental data and exponential extrapolation are shown in a graph in Figure 16.14. (Download this data [XLSX, 43 kB])
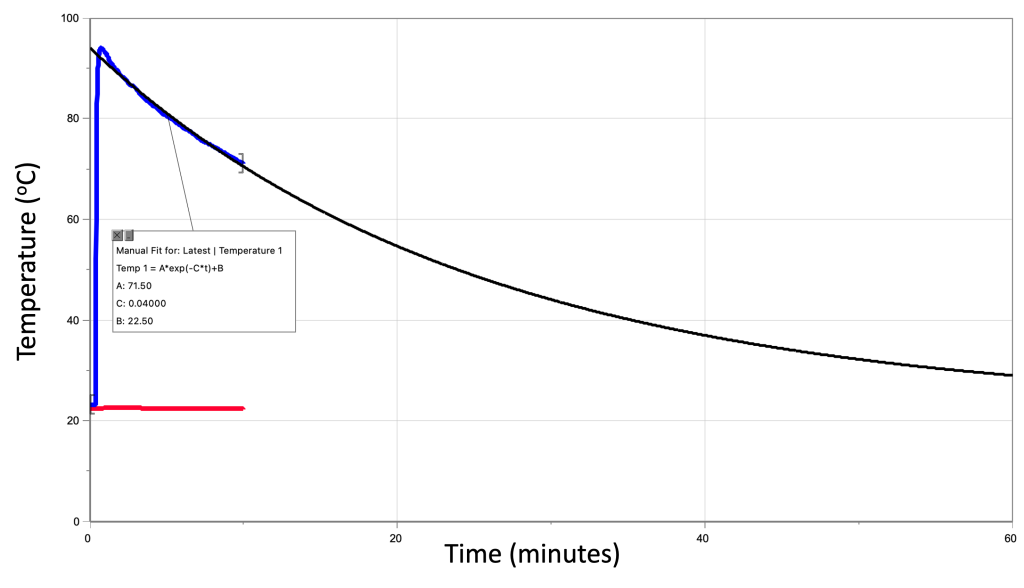
At the very beginning of the experiment, the temperature of the water was 94 degrees and the temperature of the room was 22.5 oC. The difference in temperature was 71.5 oC. At that time, the rate of cooling was 2.9 oC/min. That is, the slope of the line at that instant in time says that the water will cool off at that rate. Because the function isn’t a straight line, the value of the slope is constantly changing, but the value of 2.9 °C/min is valid at this particular data point.
At 7.2 minutes into the experiment, the water had cooled down to 76.1 oC. At that point the temperature difference is 53.6 oC, three quarters of the initial value. What we should expect is that the slope of the line at this point will also be three quarters of 2.9 oC/min. According to the extrapolation, it is 2.1 oC/min, which is in very close agreement with that expectation.
We can look at a few more points and see that this trend is satisfied for all of the data calculated in this experiment. 17.3 minutes in, we would expect the temperature of the water to be 58.3 oC and the difference in temperature to be 35.8 oC, one half the original value. Now the slope of the line at this point would be about one half the original value, 1.4 oC/min.
Finally, 34.6 minutes into the experiment, the temperature of the water should be 40.4 oC and the temperature difference should be 17.9 oC, one quarter of the initial value. We would expect the slope to be one quarter the initial slope: 0.7 oC/min.
The slope continues to decrease over time. That is to say, as the water gets closer to room temperature, it cools down slower and slower, until eventually it asymptotically reaches the temperature of the room and is in thermal equilibrium.
Further reading
- Solar power – This page from the International Energy Agency gives information about solar power and its importance in reducing the effects of global climate change.
Practice questions
Numerical analysis
- How large would perfectly efficient solar panels need to be to power a business using 8,500 W of electrical power?
- If solar panels are only 15% efficient, calculate the size of the solar panels required for the business using 8,500 W of electrical power.
- A household has 1 m2 of solar panels, generating 150 W of electrical power. How efficient are the solar panels?
- Hot, freshly baked cookies are removed from the oven at a temperature of 200 oC into a room that is 20 oC. At that moment, the cookies cool at a rate of 4 oC/min. How quickly do the cookies cool when the temperature of the cookies is…
- …110 oC?
- …65 oC?
- …42.5 oC?
Conduction is heat transfer that occurs due to collisions among atoms, electrons, or molecules.
Heat is energy that is transferred from one object to another in response to a difference in temperature. (symbol: Q, unit: cal)
Temperature defines the average kinetic energy of an object. It quantifies the “hotness” or “coldness” of something. (symbol: T, unit: °C or K)
Energy is defined as the capability of an object (or collection of objects) to do useful work. (symbol: E, unit: J)
A solid is a substance where the molecules or atoms are very tightly bound together. This gives a solid a very rigid volume and shape. Solid is one of the four most common phases of matter.
A liquid is a state of matter in which the constituent molecules will change their shape or arrangement but cannot be easily compressed to change their volume. Liquid is one of the four most common phases of matter.
Gas is a state of matter where molecules are very free to move about and generally do not interact with each other except during collisions. This means that the shape and volume of a gas is free to change. Gas is one of the four most common phases of matter.
Conduction is the motion of electrical charge within a material or between different materials.
An electron is a fundamental building block of matter that has a negative charge and is found surrounding the nucleus of an atom.
Specific heat capacity defines how difficult it is to change the temperature of a substance. It describes the amount of heat required to change the temperature of a certain mass of a substance by a certain temperature. (symbol: c, unit: cal/(g°C))
Convection is heat transfer that comes about due to the motion of molecules themselves.
Electromagnetic radiation is heat that is transferred from one place to another through light waves.
The wavelength of a wave describes the shortest distance between two identical repeating points on a wave. (symbol: λ, unit: m)
Absorption of light occurs when light waves completely transfer their energy to a medium as they attempt to pass through it. The light is therefore blocked from transmitting through the medium.
Physics is a branch of science that focuses on the fundamentals of the workings of our universe.
An electromagnetic wave is a transverse wave that contains electric and magnetic fields oscillating at right angles to each other.
An object is transparent if it allows visible light to pass through without getting scattered or absorbed.
An object is opaque if it does not allow any light to transmit through it.
Technology is the outcome of using scientific principles to solve problems. This can be a product, innovation, or other object whose creation is based on science such as physics, chemistry, or biology.
Power quantifies how quickly work is done. (symbol: P, unit: W)
A diode is a circuit element that acts like a one-way valve in that it only allows current to flow in one direction but not the other.
The solar constant is the rate at which we obtain energy from the sun. The solar constant is approximately 1,400 W/m^2.
The orbit of a satellite describes its path around a planet or star.
