30. Light emission
Summary
Light emission
Recall from a previous chapter that electrons move about in shells around the nucleus of an atom. These shells, also called orbitals, are characterized by the amount of energy of each electron. Each atom has a unique set of energy levels that each electron can occupy. The lowest energy level is known as the ground state. An electron can be bumped into higher energy levels, in which case the electron is said to be in an excited state.
We can model these different energy levels using an energy-level diagram, similar to that shown in Figure 30.1. An electron can only reside in one of the energy levels of an atom at any given time, and cannot have an energy that is in between levels. The energy levels are therefore discrete: they only have certain allowed values for their energies.
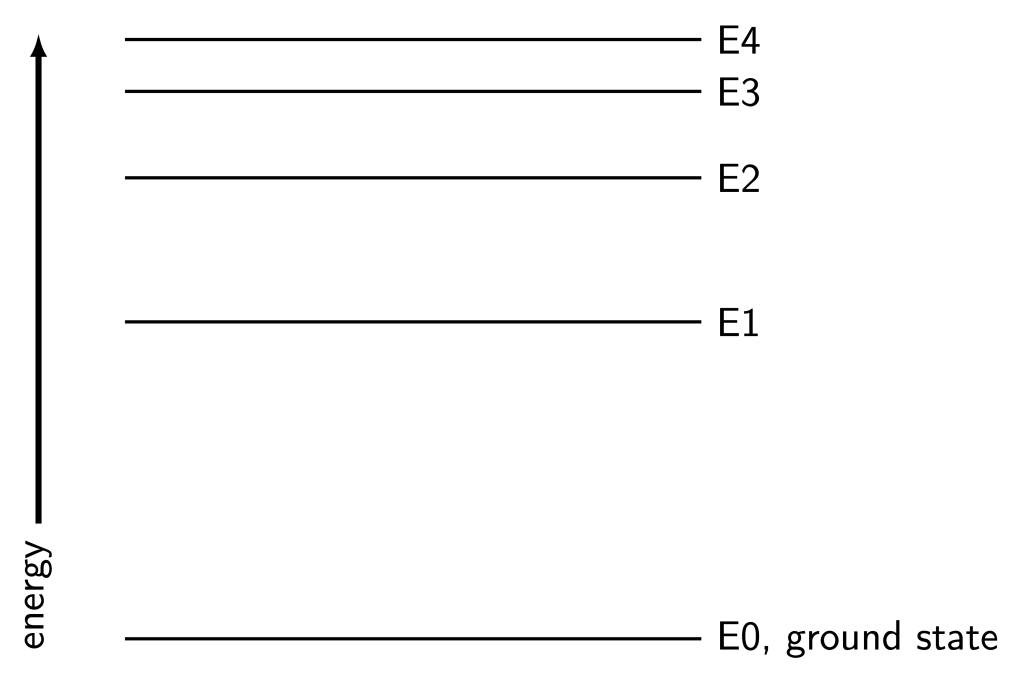
The lowest energy that an electron can occupy is called the ground state, often designated by  . The higher available energy levels are called excited states. For example, the energy level diagram in Figure 30.1 shows the first four excited states above the ground state.
Electrons can jump from one energy level to another. When an electron gains energy equal to the exact difference in energy between the (lower) starting level and the (higher) ending level, it can jump up one or more levels. Electrons can gain energy from light waves or from collisions with other electrons or subatomic particles. When electrons gain energy and move up one or more energy levels, this process is known as electron excitation.
Eventually, electrons that are in an excited state will relax back to the ground state. This process is called deexcitation. The deexcitation process can happen either as a result of a collision with another atom or with the emission of light. Either way, energy needs to be conserved. In this chapter, the light emission process is considered. The energy of that light will be equal to the exact difference in energy between the (higher) starting level and the (lower) ending level. The frequency of the emitted light is proportional to the energy of the emitted light. The equation we can use to determine the energy difference between such levels is

where  is the energy of the light,
  is the frequency, and
  is the constant of proportionality known as Planck’s constant. Planck’s constant is equal to

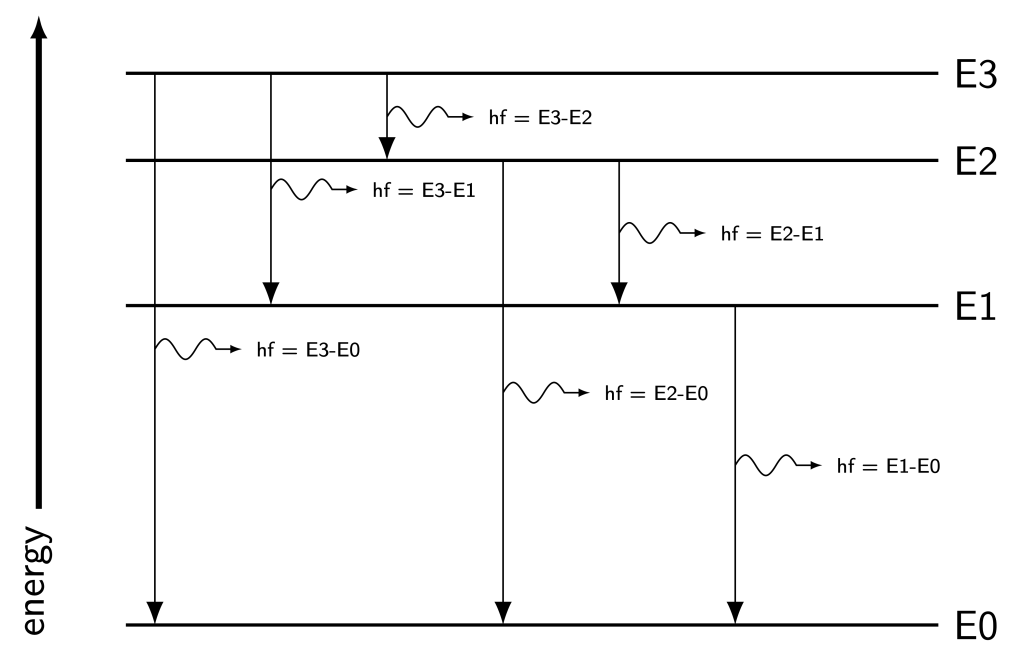
Each element has a unique configuration of energy levels. This means that each element has a unique spectrum of light that can be emitted during the deexcitation process. It’s possible for electrons to drop between any two levels, meaning that many different frequencies of light can be generated by this process. An atom with four energy levels (one ground state and three excited states) can represent up to six possible transitions, and six different frequencies of emitted light, as shown in Figure 30.2.
The collection of frequencies of light emitted by a substance via this deexcitation process is known as its emission spectrum. The measurement and analysis of these spectra is known as spectroscopy. Using spectroscopy, it’s possible to determine the composition of gases (for example, stars, among other things) by examining the frequencies of light they emit. These frequencies can be compared to known emission spectra of different elements, such as hydrogen and helium, to determine the exact elements that are present in stars and other celestial bodies. This is particularly useful as it is not feasible to obtain samples from stars to bring back to Earth to measure using other methods!
A gas discharge lamp is a type of light source that generates light using electron excitation and deexcitation. A gas discharge lamp contains a tube filled with a gas. When a large voltage is applied to that gas, it is given enough energy to ionize the gas. Ionized gas contains many mobile electrons, which can create current. This current causes collisions between electrons and other ions of the gas, which excites electrons. When the electrons deexcite, light is emitted.
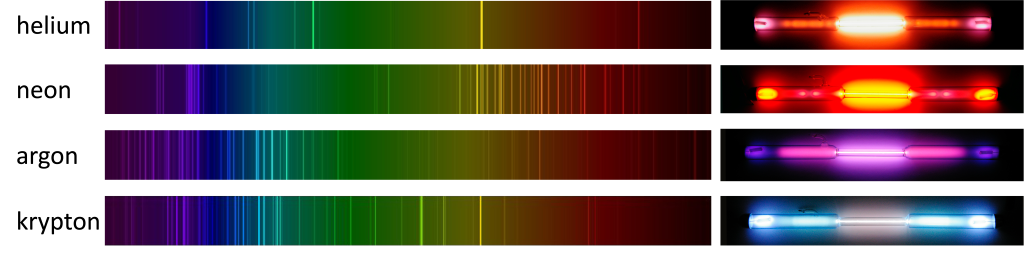
The spectra of gas discharge lamps can be measured with a diffraction grating. The spectra for a few different gas discharge lamps, and photographs of the light they produce, are shown in Figure 30.3. The distinct color of each lamp comes from the combination of all of the wavelengths of visible light that they emit.
Before LED lighting was ubiquitous, many stores would use “neon lights” for their signs. These neon lights could contain neon, a noble gas that emits an reddish orange color, or other gases that emit different colors. “Neon” lights are shown in Figure 30.4. Note that each color is generated with a different gas.

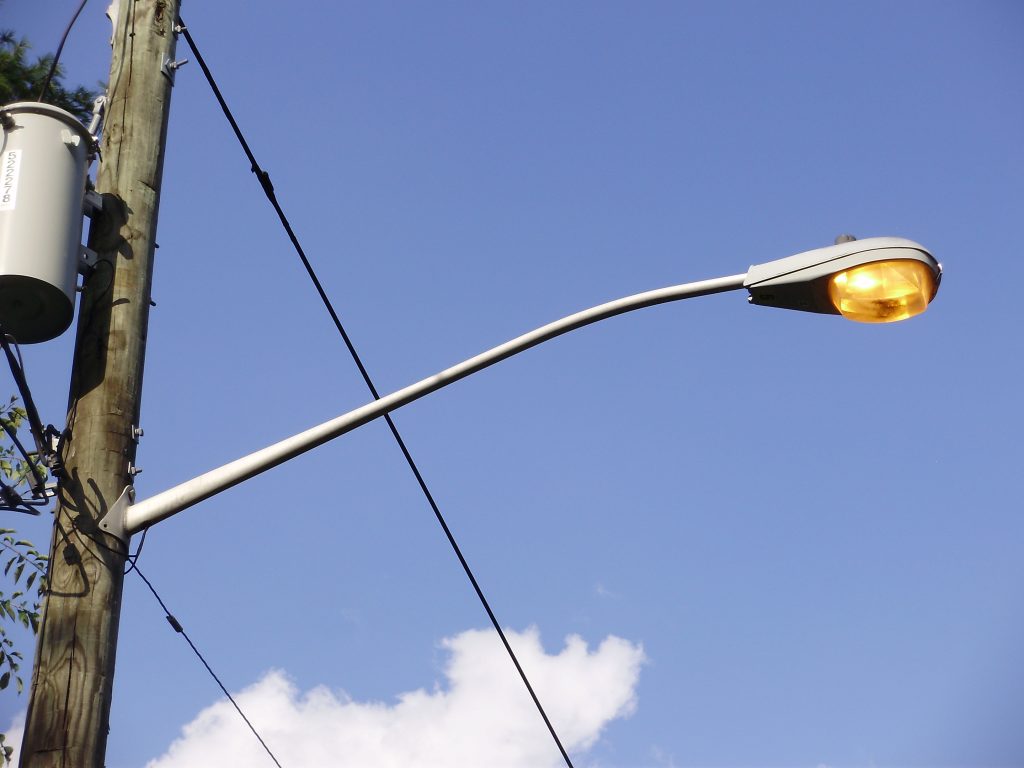
Sodium vapor lights were commonly used on highways, as they are a relatively efficient way to generate high intensity lighting, perfect for driving at night. Sodium vapor lamps can be identified by their unique yellow hue, as shown in Figure 30.5. Many of these lamps are being replaced by LEDs, which are capable of generating a more pleasant white color.
X-rays
In 1895, a new type of electromagnetic wave was discovered when a beam of electrons emitted from a cathode-ray tube caused a nearby piece of paper to fluoresce (a process that will be described later in this chapter). These electromagnetic waves were called “x-rays” due to the fact that their characteristics were unknown at the time. That name has persisted, and we continue to call this type of electromagnetic radiation x-rays even today. While not much was known about the properties of x-rays at the time of their initial discovery, it was known that the rays did not contain any electric charge, due to the fact that they did not deflect in the presence of electric or magnetic fields.
It is now known that x-rays are a type of high-energy electromagnetic radiation produced when highly energetic electrons are quickly slowed when they strike the positive electrode (called the anode) in a cathode-ray tube. The slowing of the electrons produces x-rays consisting of a continuum of energies over the frequency range of x-rays. Maxwell’s equations (the equations used to determine the properties of electromagnetic waves) state that any time a charged particle accelerates (speeds up, slows down, or changes direction), light will be emitted. A broad range of energies is generated due to the collisions between the electrons and the anode. Some electrons may slow down with a single collision (in which a lot of energy is released at once), and others may slow down with multiple collisions.
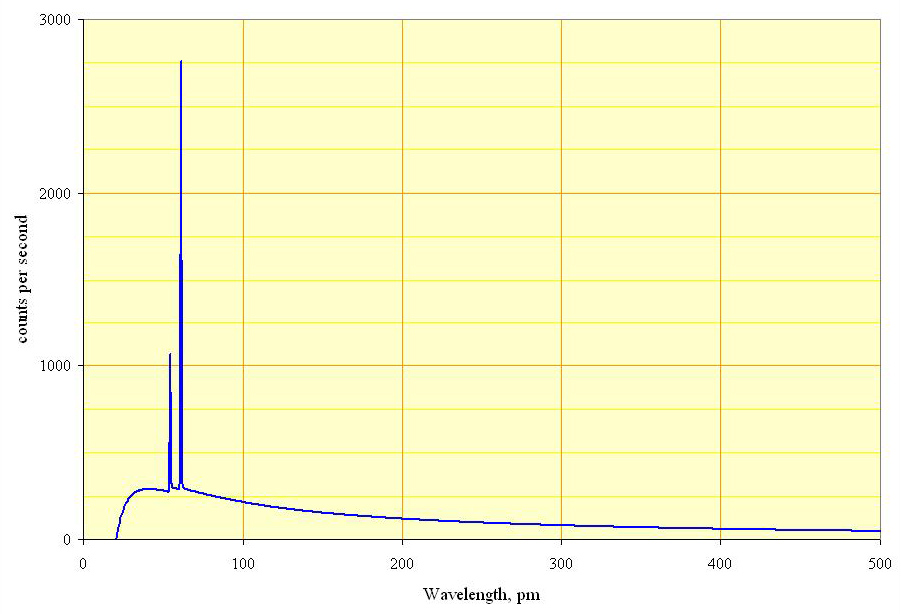
In addition to the continuous spectrum generated by collisions with the anode, these collisions can knock the electrons in the anode’s atoms into excited states. As those electrons deexcite, they produce x-rays as well. Because the deexcitation process occurs at only specific wavelengths for different materials, these show up on an emission spectrum as very discrete frequencies or energies. A typical x-ray spectrum is shown in Figure. 30.6. The broad background represents the braking radiation (x-rays generated by collisions with the anode), and the discrete spikes represent the emission lines from electron deexcitation (x-rays generated by the deexcitation of excited anode electrons).
Light absorption
While an emission spectrum showcases the light emitted by a material, an absorption spectrum shows the wavelengths of light that are absorbed by a material. If white light is shined upon a sample, the sample can absorb particular frequencies (given by its energy-level diagram) causing excitations in the material. Those frequencies will be subtracted out from the white light, and appear as black lines in the absorption spectrum, as shown in Figure 30.7.

Incandescence
Incandescence is a form of light emission previously discussed in this textbook in the context of heat transfer. All objects emit electromagnetic radiation with a frequency that corresponds to the temperature of that object. Relatively cool objects such as humans, plants, and animals emit light in the infrared portion of the electromagnetic spectrum. Hotter objects will emit light with higher frequencies. At a high enough temperature, objects will emit visible light.
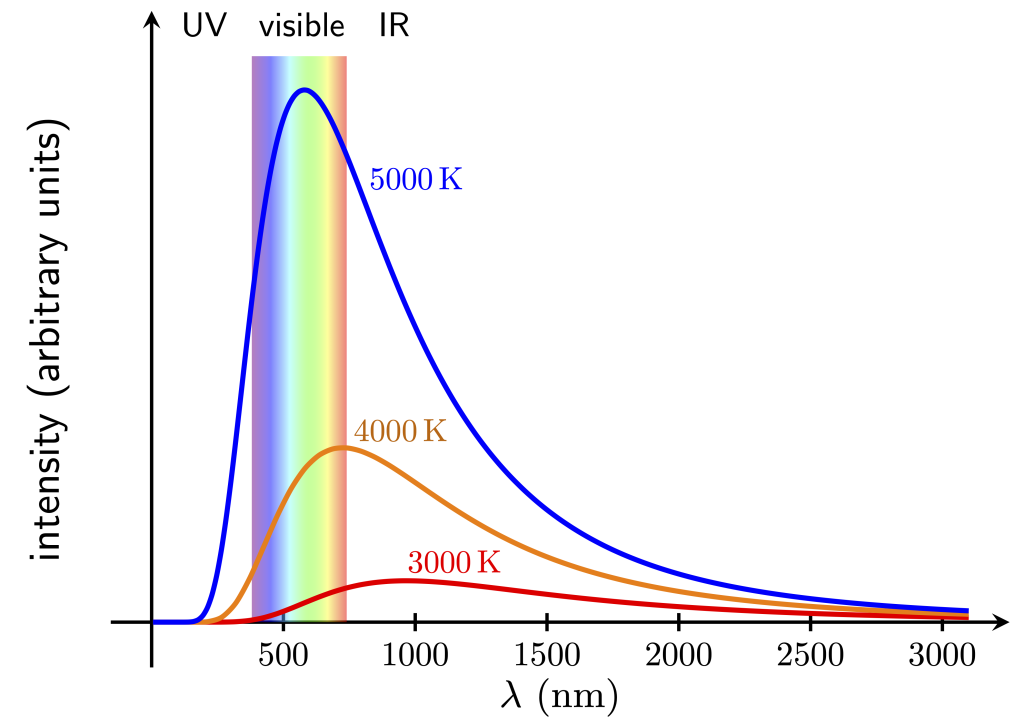
Unlike an emission spectrum, the incandescence spectra of objects is a continuous spread of frequencies (and therefore energies) as opposed to discrete frequencies as seen in the deexcitation of gas atoms. Furthermore, the incandescent spectrum is the same at a given temperature regardless of the material. The incandescent spectrum for different temperatures is shown in Figure 30.8. Notice that cooler objects emit light at wavelengths longer than visible. Hotter objects overlap with the visible portion of the electromagnetic spectrum, which will appear white if enough colors are emitted by the object. The discovery of the correct mathematical expression for the intensity of the incandescent spectrum as a function of frequency was made by Max Planck in 1900.
In this manner, we can use the color of an incandescent object to determine its temperature. An incandescent object that appears red or orange is cooler than an incandescent object that appears white or blue.
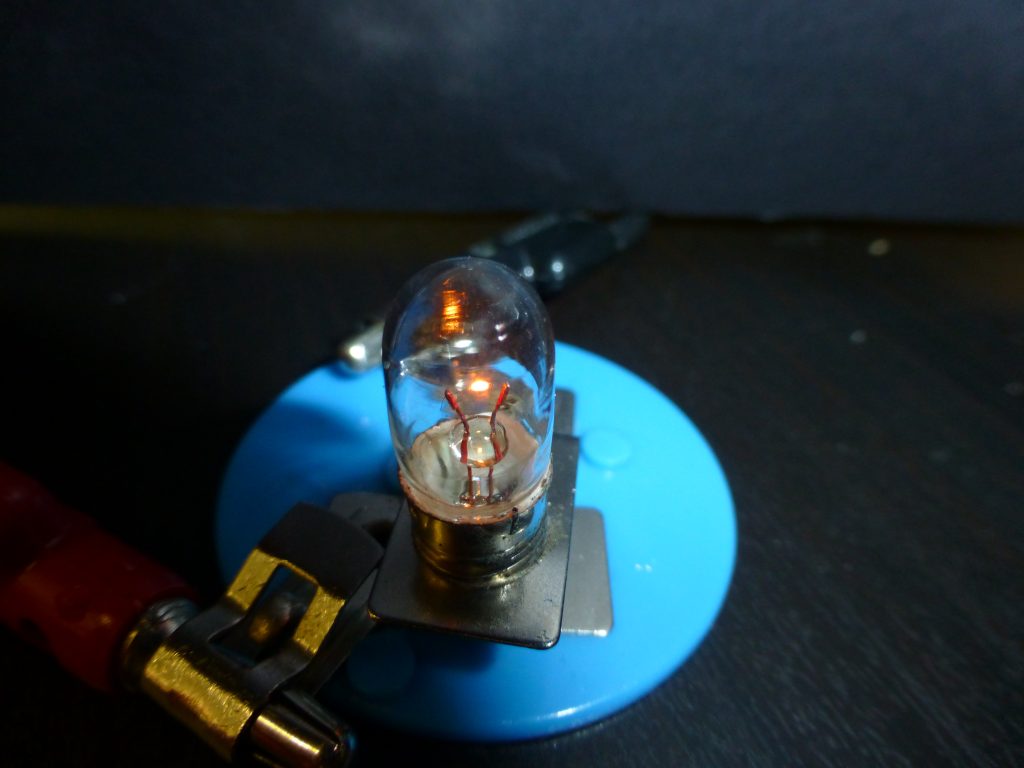
Incandescent light bulbs use the property of incandescence to generate white light. A very thin filament is heated by passing electric current through it. This heat causes the filament to glow with multiple overlapping wavelengths of visible light (shown in Figure 30.9). The mixture of all frequencies of visible light creates white light.
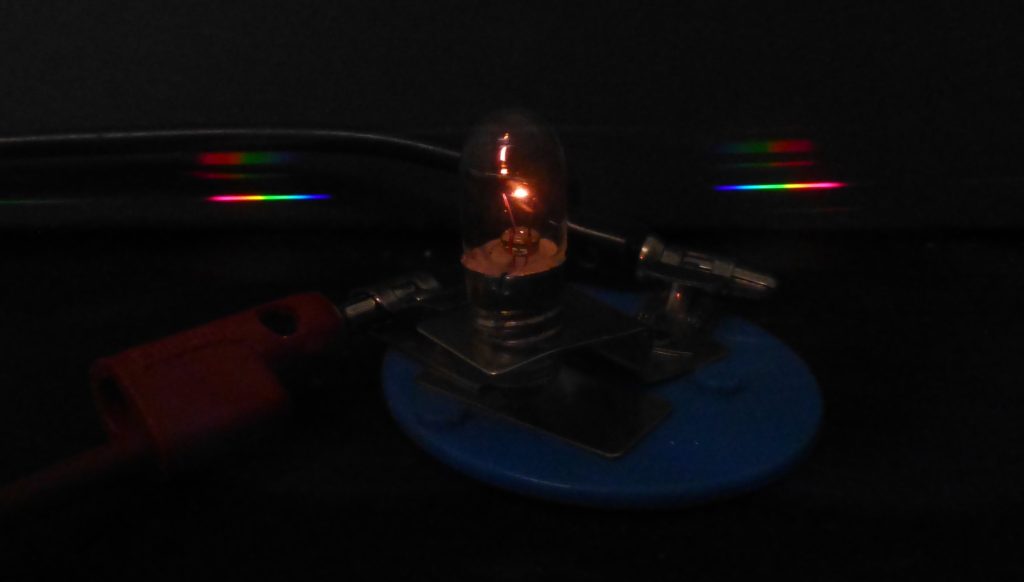
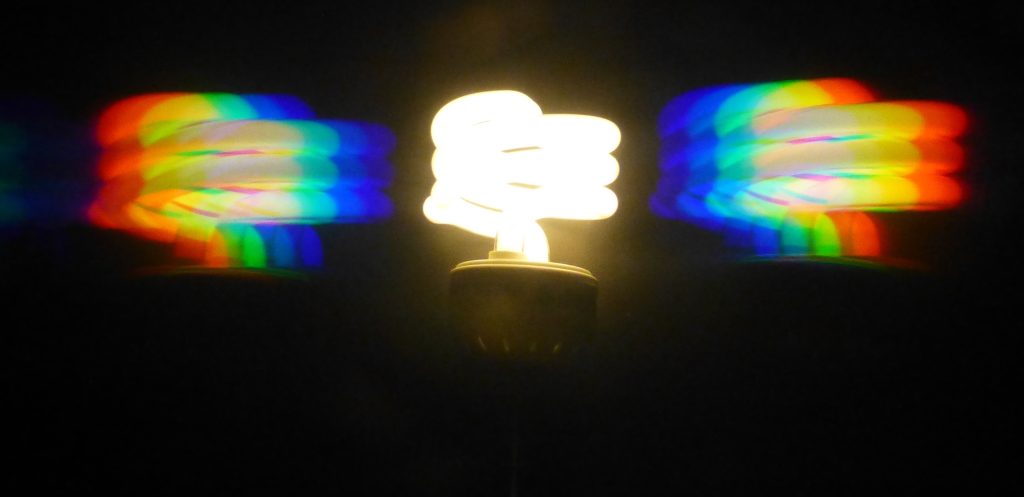
Using a diffraction grating, we can see a continuous rainbow spectrum emanating from an incandescent light bulb, shown in Figure 30.10.
Today, we use incandescent bulbs less and less in our homes and work environments, as the process of incandescence to generate light is very inefficient. (In fact, incandescent light bulbs have been or are being phased out in many countries around the world.) The power consumed by incandescent light bulbs is quite high compared to LED and fluorescent lights. Most of the electrical energy used to light an incandescent bulb is wasted as heat.
In the video below, Dr. Pasquale uses a hand-crank generator to light up different bulbs. First, she cranks the generator to light up an incandescent bulb. This takes rather a lot of energy to do, and the bulb lights dimly. Then, she turns the crank to light the LED bulb. This bulb lights right away, as it is very easy to illuminate. An LED bulb requires much less energy to function. However, note that the LED only illuminates every half cycle when powered by an AC generator. This problem can be fixed in home lighting by converting AC to direct current (DC), as previously discussed in this textbook.
Other examples of incandescence in our daily lives are seen in electric stoves and toasters. Both of these objects contain resistive heating elements. Electric current is sent through the heating elements, which then warm up due to their resistance. At cool temperatures, they will glow red, as seen in Figure 30.11 for a hot toaster. As they warm up, they will glow orange, or possibly even yellow if very hot. Note that when the electric stove or toaster is turned off, both still emit light via incandescence! However, we can no longer see it. As the objects are likely at room temperature, we can expect that light to be in the infrared region of the electromagnetic spectrum, and therefore not visible.

Fluorescence
Fluorescence is a process of light emission where an object absorbs light at a high frequency, causing electron excitation. During the subsequent deexcitation process, light is then emitted at a lower frequency. During this process, a minor amount of heat is generated, which is what causes that change in frequency between the absorbed and emitted light. Energy is conserved. An energy-level diagram depicting this process is shown in Figure 30.12.
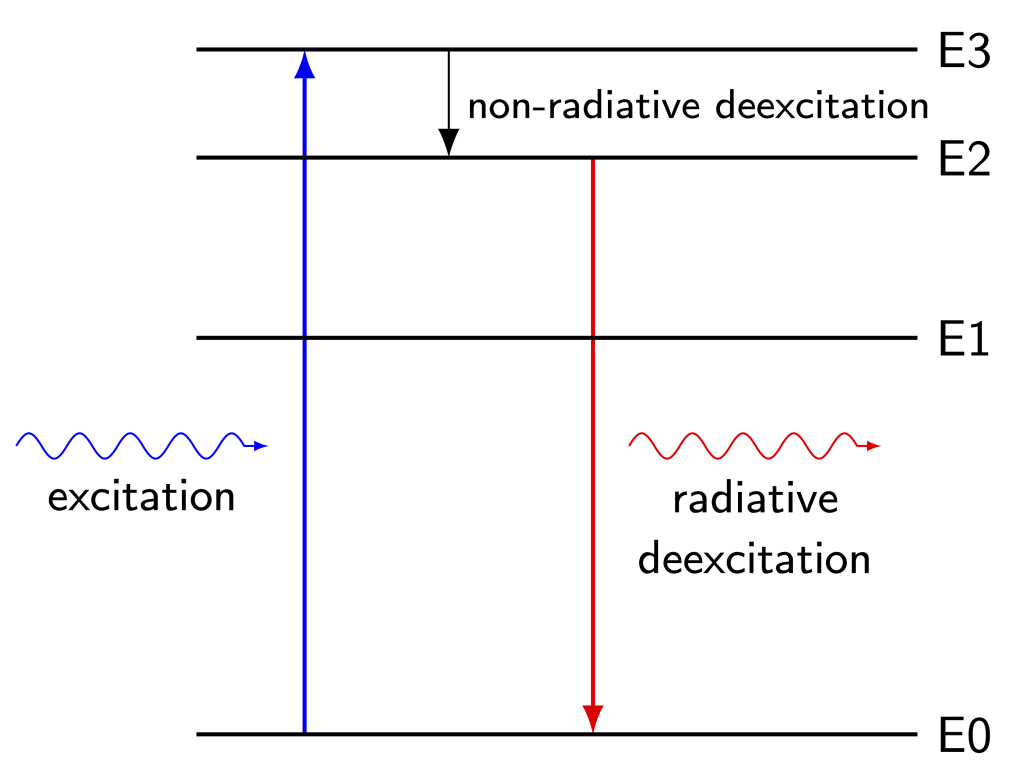
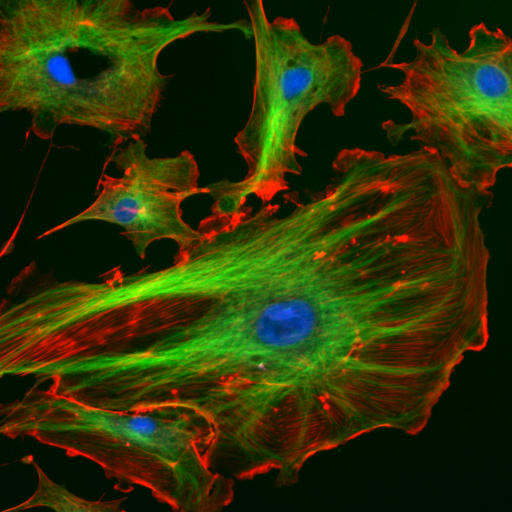
Fluorescence has many applications in the medical field. A fluorescent dye can be attached to certain types of cells or other biological materials. When excited with the high frequency light, the fluorescent dye will emit light at a different frequency. This is particularly useful because the high frequency light is usually bright enough to overwhelm any other light. By filtering that high frequency out, only the fluorescent light can be collected, allowing scientists and doctors to see only the parts of samples that are attached to the fluorescent dye. They emit at a different frequency and would not be blocked by that filtering process. In this manner, particular types of cells can be imaged (endothelial cells imaged by fluorescence are shown in Figure 30.13), biological processes can be viewed, and the presence or volume of cancer or bacteria can be measured.
Fluorescence is also present in nature. Some types of animals and fish exhibit fluorescence. Even plants contain a fluorescent molecule: chlorophyll. Some minerals in rocks are fluorescent as well. We can see these colorful fluorescent emissions when shining a UV light on the minerals, as demonstrated in the video below.
Fluorescent components are also used in everyday items such as highlighter pens (to create the bright “neon” colors) and laundry detergents (to act as an optical brightener).
Phosphorescence
Phosphorescence is a light emission phenomenon akin to fluorescence. Similarly to fluorescence, a phosphorescent material will become excited by high frequency light and re-emit lower frequency light. However, in phosphorescence, this process of re-emission is extended for a time period even after the exciting source is removed. Sometimes it is a few seconds, sometimes it can be several minutes or hours. In other words, phosphorescence is essentially the same thing as fluorescence, except that the electrons in the excited state remain there for an extended period of time rather than dropping back down immediately after the source of the excitation is removed.
Many “glow-in-the-dark” paints are phosphorescent. When illuminated during the day with sunlight or room lighting, the electrons in the material gain energy. At night, after the illumination is removed, the glow-in-the-dark paint will slowly re-emit the lower frequency light over the span of several minutes or even hours. This is demonstrated in the video below. Dr. Pasquale has a light shining on a glow-in-the-dark star. After turning off the light, the star continues to glow.
Chemicals known as phosphors may emit light using the process of fluorescence, and some may emit light using the process of phosphorescence. Phosphor coatings are very common when high energy light is used to generate white light. By mixing multiple phosphorescent or fluorescent chemicals together, a mixture of red, green, and blue light can be generated to create white light for use in home lighting.
Fluorescent lights
Fluorescent lights use the properties of light emission and phosphorescence to generate light. A mercury vapor inside of a glass tube is excited into a plasma by the application of high voltage. Mercury plasma emits light in the UV region of the electromagnetic spectrum. On its own, this UV light would be useful for sterilization or other medical uses, but would not be a good light source for our homes due to the presence of ionizing radiation.
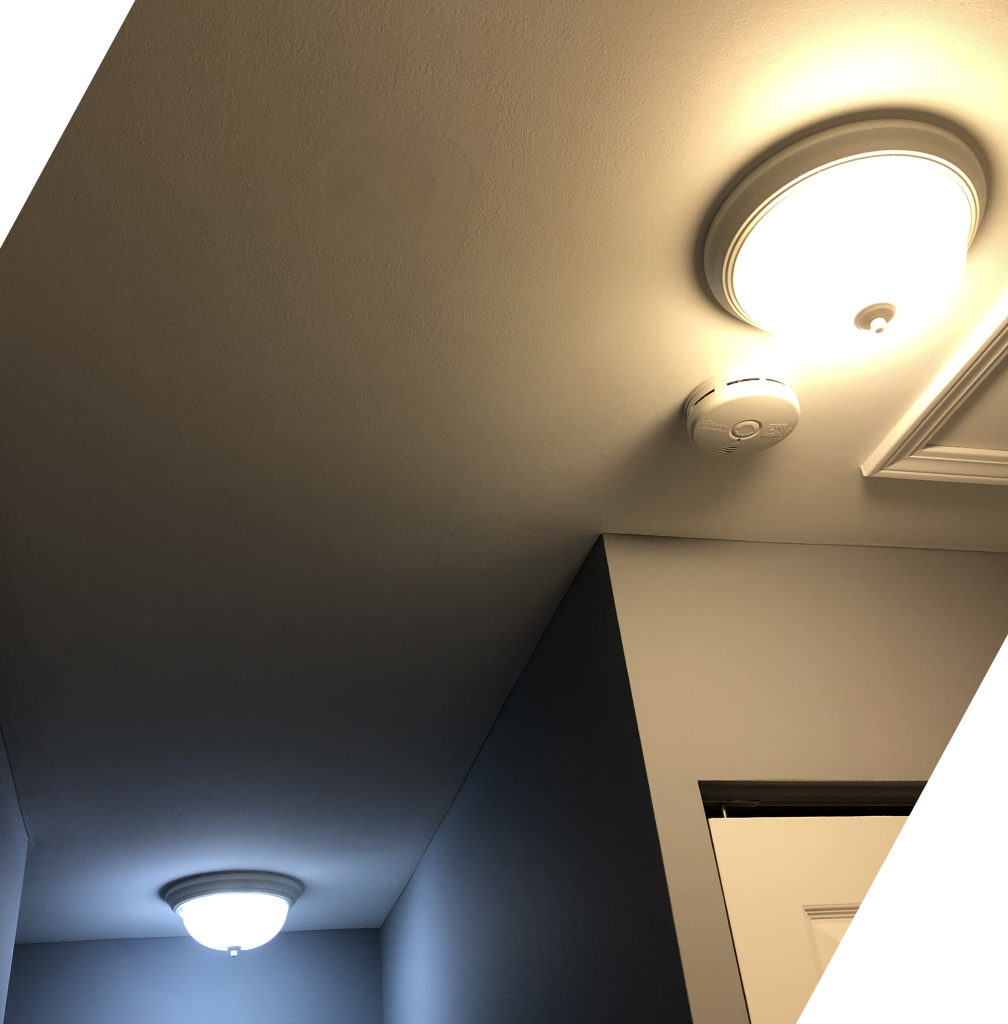
The surface of a fluorescent light tube is coated with a phosphor. This phosphor absorbs the high-energy UV light and generates other colors of light. The exact chemicals used in the phosphor coating depend on the color temperature of the light. In what may be considered confusing language from a physics perspective, blue colors are known as “cool” and yellow colors are known as “warm” in color theory. Often, this nomenclature will be used on boxes of indoor lighting. However, “cool” lights from the blue part of the visible spectrum are actually at a higher temperature (typically 5000 K) than “warm” lights from the yellow or red part of the visible spectrum (typically 3000 K). When you go to the hardware store to purchase fluorescent bulbs, you will see different color temperatures available, depending on the lighting effect that you prefer. An image of two light fixtures, one fitted with “warm” (3000 K) and one fitted with “cool” (5000 K) bulbs, is shown in Figure 30.14.
Because the mercury vapor emits light at discrete frequencies, and the phosphor coating also emits light at certain frequencies (although the phosphor emission has a broader spectrum), when using a diffraction grating to look at the spectrum of a fluorescent bulb, the combination of both of these effects can be seen. Each of the lines of the mercury vapor emission spectra can be seen, with some blurring between those lines due to the broad phosphor emission spectrum. This is shown in Figure 30.15.
Light-emitting diodes
Light-emitting diodes (LEDs) use two layers of semiconducting material stacked together to create current when a voltage is applied in a certain direction. A diode, discussed previously in this textbook, acts like a one-way valve that only allows current to flow in one direction, if voltage is applied in the correct orientation. An LED is a special type of diode that emits light when current flows.
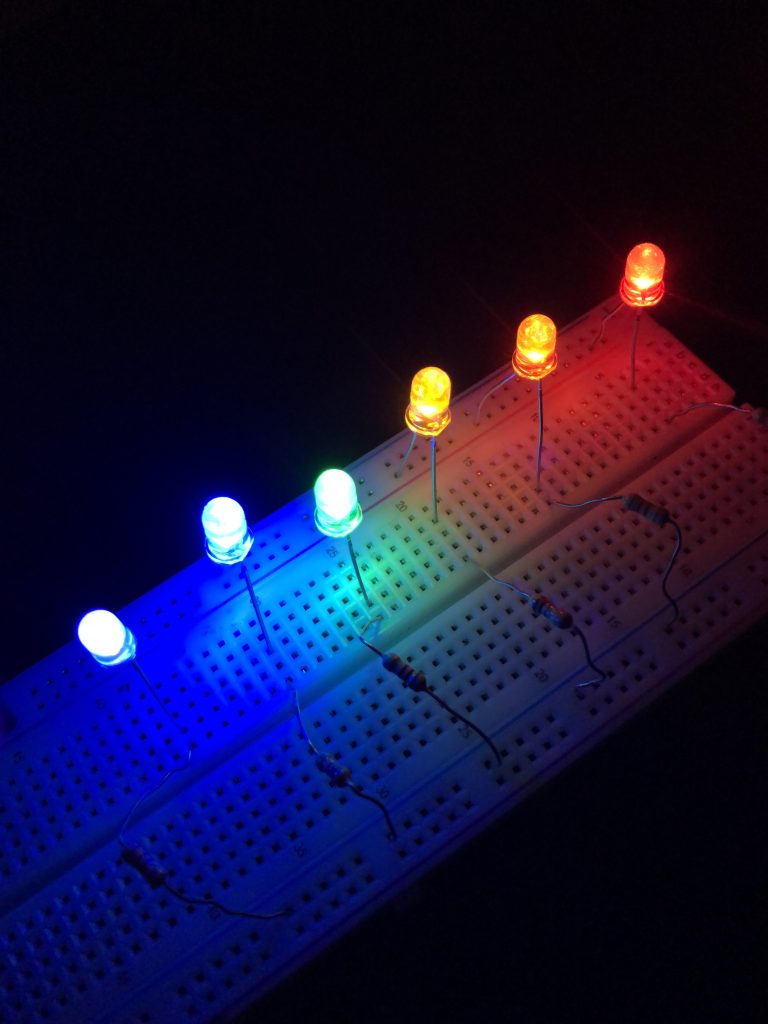
Every light-emitting diode will generate light at a particular frequency, given by the exact semiconductor that’s used to create it. Because of this, light-emitting diodes are monochromatic. However, engineers and scientists have created LEDs that can generate frequencies from UV to infrared. A selection of several different colored LEDs are shown in Figure 30.16. These are small LEDs used for electronics and hobbyist projects. (Perhaps you have seen LEDs similar to these that are used as indicator lights in appliances or other electronics.)
Monochromatic light may be appropriate for indicator lights or for use in specific electronic projects, but how can LEDs be used to generate white light, which is required for home lighting? In fact, LEDs can be used to generate white light using two different methods.
The first method for generating white light from an LED is to package three separate LEDs together: one red, one green, and one blue. This is known as an RGB LED. A close-up photograph of an RGB LED, showing the separate red, green, and blue diodes, is shown in Figure 30.17.
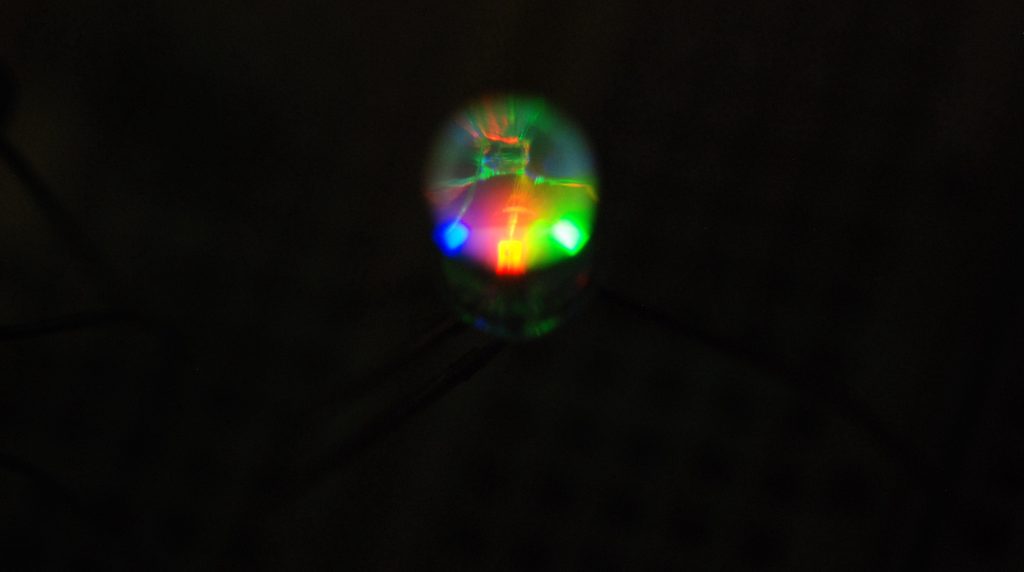
By combining red, green, and blue light together using the color addition process described earlier in this textbook, white light can be generated. RGB LEDs are also used in tunable light bulbs (whose color can be changed by the user). The addition of red, green, and blue LEDs to generate white light is demonstrated in the video below.
The second method for generating white light is similar to that used in fluorescent bulbs. An ultraviolet LED is packaged in a piece of epoxy that is coated with a phosphor. Depending on the exact phosphorescent chemicals used, different color temperatures of white LED bulbs are achieved.
A household light fixture containing integrated LED lights is shown in Figure 30.18. The light fixture contains electronics in the center to convert the high voltage AC signal to a lower value DC voltage appropriate for lighting the LEDs (which is also adjustable for use with a household dimmer switch). The LEDs themselves are arrayed in a circular pattern around the edge of the fixture. Each individual LED is rather small, so many of them are used to generate bright light for our homes.

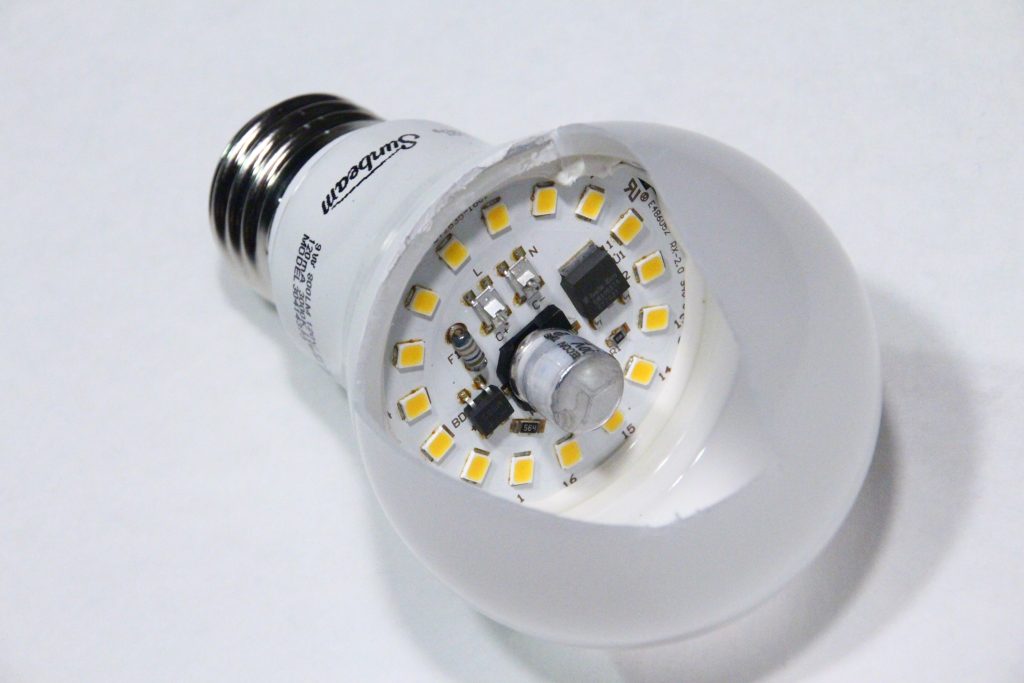
An LED light bulb contains similar circuitry inside the bulb casing. This is why LED light bulbs tend to be heavier than similarly sized incandescent light bulbs. An LED light bulb with the casing broken to display the interior components is shown in Figure 30.19.
Photovoltaic panels, or solar panels, function by the reverse process. Light that’s absorbed by a semiconducting material will generate electric current. This is an excellent method of creating energy that does not require fossil fuels, and uses a process totally different from the generators discussed in a previous chapter.
Lasers
The term laser is an acronym for light amplification by stimulated emission of radiation. A laser contains a light source to start this light amplification process. (A laser pointer will likely contain a light-emitting diode as a light source.) This light source shines into an amplifying medium. This can be a gas or even a solid material that amplifies light by means of stimulated emission. Stimulated emission occurs when an electric field is used to provoke deexcitation of many electrons, all of which emit photons that are identical to each other. While this is a very complicated process, in general it means that the material is capable of generating more light from the initial light source. (There is an energy source used; a laser does not violate conservation of energy!)
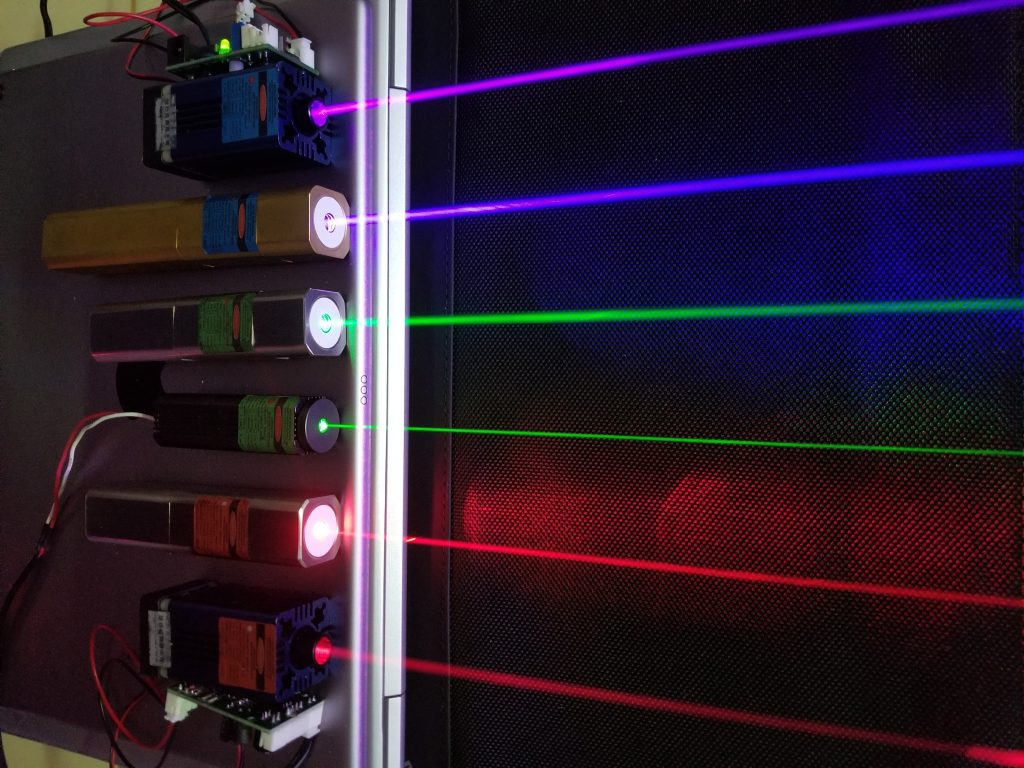
In addition to the amplifying material, a laser contains two mirrors on each end to cause the light waves to travel back and forth throughout the material. This does two things: first, it causes the light to spend more time in the amplifying material, creating more light by stimulated emission. Second, it causes the light waves to interfere, creating light waves that are all in the same phase and have the same wavelength using the process of constructive interference. Because the output light all has the same wavelength, a laser is a monochromatic light source. Different types of lasers will emit at different frequencies. The output from six different lasers is shown in Figure 30.20.
The output of a laser contains light waves that are very high-intensity and also completely identical. (Because of the high intensity output, it is extremely important to exercise caution when using lasers, as they can cause vision loss or even blindness if used incorrectly.) This type of light is known as coherent light. Coherent light means that all of the waves have the same frequency and phase.
The properties of laser light make them extremely useful in many scientific, medical, and industrial applications. In communications, lasers are used to send optical data along fiber optic cables (using the property of total internal reflection to remain inside the cable). They are also used to read or write from optical discs such as CDs and DVDs. Industrial uses of the high intensity output generated from lasers include laser welding and cutting. The straight lines projected by lasers have use in construction and surveying. Medical uses of lasers include cancer treatment and laser eye surgery. In addition, scientists and engineers frequently use lasers in scientific and medical research.
Further reading
- December 1958: Invention of the Laser – This article from the APSNews “This Month in Physics History” series covers the invention of the laser.
Practice questions
Conceptual comprehension
- If you are able, go outside on a clear day and look at the sky (preferably with a telescope). If you do not have access to an unobstructed sky or telescope, take a look at the January 16, 2024 NASA Astronomy Picture of the Day. What does it mean for some of the stars to appear red and for some of the stars to appear blue?
Numerical analysis
- A hydrogen atom requires the absorption of a light wave containing
 of energy to ionize its electron. Calculate the wavelength and frequency of a light wave with that value of energy.
 - Consider the energy-level diagram shown in Figure 30.21. Calculate the…
- …total number of electron transitions.
- …amount of energy required to jump from the ground state (E0) to E2.
- …wavelength of light corresponding to the energy difference between the ground state (E0) and E2.
- …largest energy transition.
- …wavelength of light corresponding to the largest energy transition.
- …smallest energy transition.
- …wavelength of light corresponding to the smallest energy transition.

The orbit of an electron describes the properties of the electron wave as it exists around the nucleus of an atom.
Energy is defined as the capability of an object (or collection of objects) to do useful work. (symbol: E, unit: J)
An electron is a fundamental building block of matter that has a negative charge and is found surrounding the nucleus of an atom.
Energy levels describe the quantity of energy that each electron orbiting an atom can have. Each atom is uniquely defined by its discrete energy level values. The lowest energy level is known as the ground state.
Electron excitation is the process by which an electron gains energy and moves up one or more energy levels.
Electron deexcitation is the process by which an electron loses energy and jumps down one or more energy levels. In the process, the electron either transfers energy to another particle, emits a photon, or generates heat.
Frequency describes how many oscillations occur per second in a wave. (symbol: f, unit: Hz)
An element is a substance that consists of atoms whose nuclei have the same atomic number. An element cannot be broken down further by chemical means.
The collection of frequencies of light emitted by a substance via the electron deexcitation process is known as its emission spectrum. It appears as bright lines on a dark background.
Gas is a state of matter where molecules are very free to move about and generally do not interact with each other except during collisions. This means that the shape and volume of a gas is free to change. Gas is one of the four most common phases of matter.
Voltage is a difference in electric potential between two points in a circuit. It can be considered as a "push" that causes current to flow. (symbol: V, unit: V)
Ionization is the process by which a gas is converted into a plasma.
Current describes the flow of electric charge through a circuit. (symbol: I, unit: A)
An ion is a charged atom; there is an unequal number of protons and electrons in the atom.
Diffraction is a bending of a wave as it travels around a corner or through a narrow opening.
The wavelength of a wave describes the shortest distance between two identical repeating points on a wave. (symbol: λ, unit: m)
Intensity describes the amount of energy per unit of area that reaches a certain location every second (unit: W/m^2)
An electromagnetic wave is a transverse wave that contains electric and magnetic fields oscillating at right angles to each other.
Electric charge is a fundamental property of matter that causes particles that carry a charge to experience a force when in the presence of an electric field.
Acceleration quantifies the rate at which an object changes its velocity. (symbol: a, unit: m/s^2)
An absorption spectrum shows the wavelengths of light that are absorbed by a material. It appears as a continuous spectrum with dark lines caused by light passing through a substance.
Incandescence is a form of light emission and heat transfer process by which an object emits electromagnetic radiation with a peak frequency that corresponds to the temperature of that object.
Electromagnetic radiation is heat that is transferred from one place to another through light waves.
Temperature defines the average kinetic energy of an object. It quantifies the “hotness” or “coldness” of something. (symbol: T, unit: °C or K)
Heat is energy that is transferred from one object to another in response to a difference in temperature. (symbol: Q, unit: cal)
Power quantifies how quickly work is done. (symbol: P, unit: W)
A generator converts mechanical work to electrical energy.
Direct current (DC) is a property of a voltage or current source in which the value of the voltage or current remains constant over time.
Resistance is the property of a material that impedes the flow of electrons throughout that material. (symbol: R, unit: Ω)
Fluorescence is a process of light emission where an object absorbs light at a high frequency, causing electron excitation, and during the deexcitation process emits light at a lower frequency.
Phosphorescence is a light emission phenomenon similar to fluorescence. However, the deexcitation process takes place on a timescale that extends after the excitation source is removed.
Plasma is ionized gas. Plasma is the most common phase of matter in the universe.
The electromagnetic spectrum describes the entire range of electromagnetic waves. Each subset of waves can be defined in different categories based on its frequency or wavelength.
Ionizing radiation refers to electromagnetic waves (UV, x-rays, and gamma rays) that contain sufficient energy to ionize atoms. These waves can cause damage to human DNA and other tissue.
A diode is a circuit element that acts like a one-way valve in that it only allows current to flow in one direction but not the other.
Color addition refers to the ability to use light to create secondary colors from primary colors (red, green, and blue).
A circuit is an interconnection of elements such as batteries, light bulbs, resistors, capacitors, and diodes.
A solid is a substance where the molecules or atoms are very tightly bound together. This gives a solid a very rigid volume and shape. Solid is one of the four most common phases of matter.
Interference is the phenomenon that occurs when two waves overlap. The total amount of wave energy present at a point is equal to the sum of each individual wave's energy at that point.
Coherent light means that all of the waves have the same frequency and phase.
Total internal reflection describes the phenomenon that occurs when light travels from an object with a high index of refraction to an object with lower index of refraction at an angle greater than the so-called critical angle. Light that is incident at angles greater than the critical angle will not refract at all, but will instead completely reflect off of the interface.
