12. Solids
Summary
The structure of solids
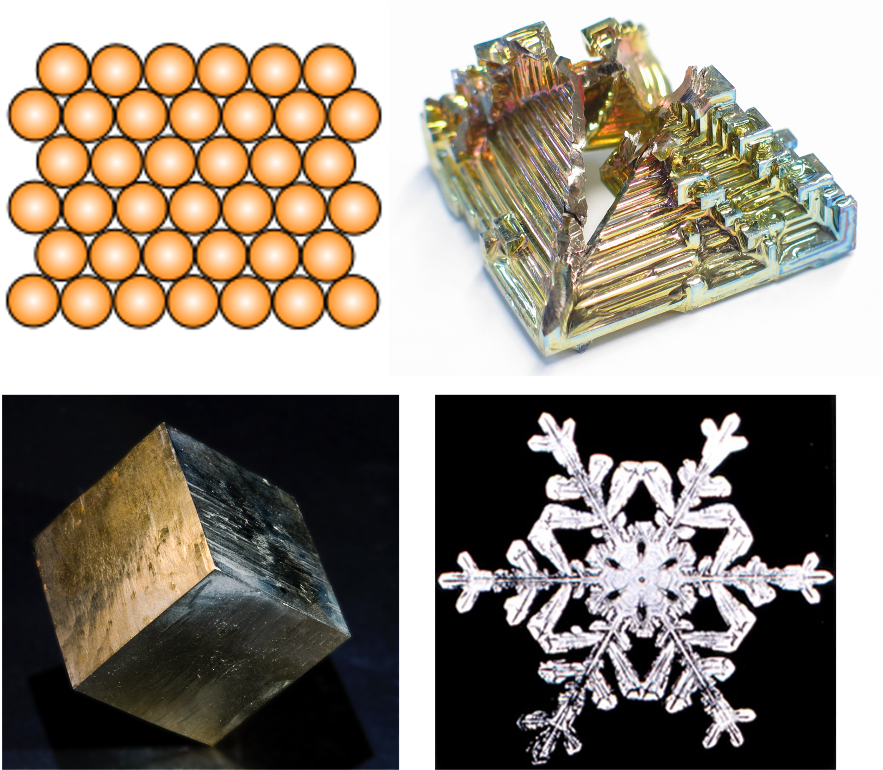
The atoms in a solid can be arranged in one of a few ways. When the atoms or molecules of a substance are arranged in an orderly, repeating manner, that solid is called a crystalline solid. In a crystal, knowing the location of one set of atoms allows us to determine the location of all other atoms in the solid, because that atomic pattern, known as a unit cell, will repeat itself regularly. Examples of crystalline solids include diamonds, quartz, and snowflakes.
Figure 12.1 (top left) shows an example of the arrangement of molecules in a crystal; these molecules are orderly and the arrangement is predictable. On the macro scale, crystalline solids are notable for appearing to have orderly structures. Figure 12.1 shows three examples of crystalline solids: bismuth (top right), pyrite (bottom left), and a snowflake (bottom right).
Some crystalline solids have special properties. Silicon, for example, is grown in labs into large crystals called boules. These silicon boules are sliced into wafers. The crystalline nature of silicon makes it a high-quality semiconductor, and it is used predominantly in computer chip manufacturing.
Other solids have atomic or molecular arrangements that are disordered, or that otherwise lack a regularly repeating arrangement. These solids are known as amorphous solids. Examples of amorphous solids include plastics, wax, and glass. Figure 12.2 (left) shows an example of the arrangement of molecules in an amorphous solid. A large category of amorphous solids is plastic items (Figure 12.2, right).

In between amorphous and crystalline materials is a class of material called polycrystalline. Polycrystalline materials have some order to them, but are not made of a single crystal. You can think of polycrystals as being composed of many individual crystals. Most metals and ceramics are polycrystalline.
The properties of crystalline, polycrystalline, and amorphous solids are a subject of interest to materials scientists. Materials scientists determine the properties of materials, and design new materials, for use in everything from industry and manufacturing to biomaterials and building materials.
Density
Density defines how compact the matter in an object is. The symbol for density is the capital letter  . (Note that many higher-level physics textbooks will use the lowercase Greek letter rho (
 ) to define density. In this book, we will use for simplicity’s sake.) The equation for density is mass divided by volume,

Because the SI unit of mass is the kg and the SI unit of volume is m3, the SI unit of density is kg/m3. At times, the metric unit of g is used for mass and cm3 for volume. In this case, volume can also be calculated with the unit g/cm3.
Either of these sets of units can be used, but they are not interchangeable. Furthermore, when working with quantities such as force with the unit N, it is important to ensure that density is measured using the SI unit (kg/m3)! To convert from g/cm3 to kg/m3, multiply by one thousand. To convert from kg/m3 to g/cm3, divide by one thousand. (You should try to convince yourself of this by performing the conversion given that 1 kg = 1000 g and that 1 m = 100 cm.)
Density is a property inherent to pure substances. That is, the density of gold (for example) is always going to be 19.3 g/cm3. The densest naturally occurring element is osmium, which has a density of 22.6 g/cm3.
To measure the density of a substance, first measure the mass of the object using a balance. To measure volume, there are two methods that can be used. The first is used with regularly shaped objects (such as a rectangular block) where we can measure a length, width, and height. Use a ruler or calipers to measure each dimension and multiply them together to find the volume. In other words,  .
.
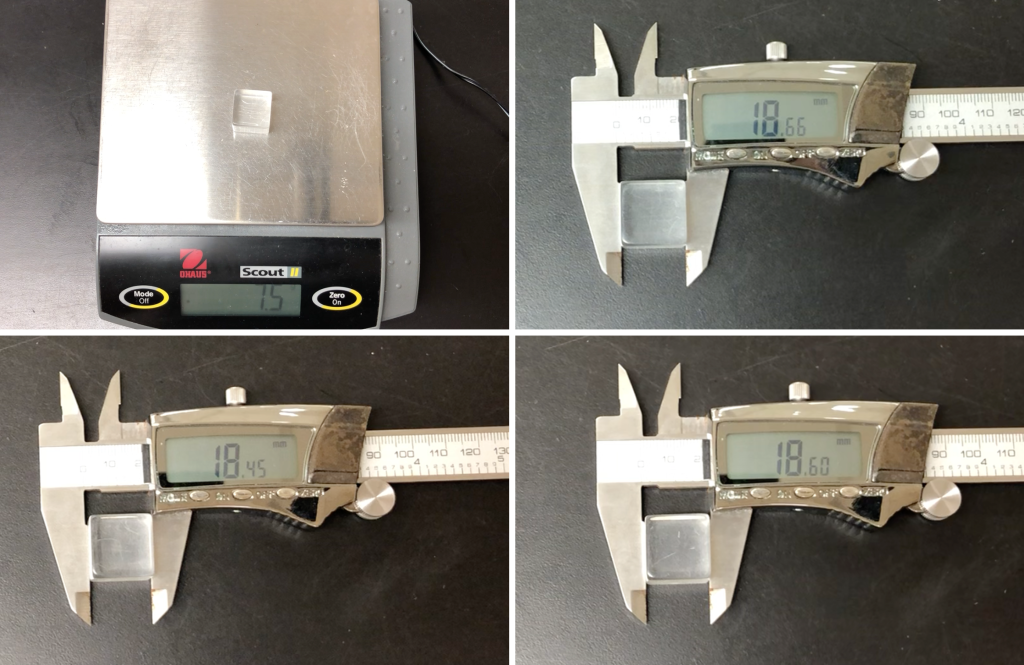
In Figure 12.3, the density of a piece of acetate (a regularly shaped object) is calculated. The mass is measured using a balance, and is 7.5 g (Figure 12.3, top left). Then, with calipers, the length (top right) is measured (1.866 cm), the width (bottom left) is measured (1.845 cm), and height (bottom right) is measured (1.860 cm). The volume of the piece of acetate is therefore

and the density of the piece of acetate is

An irregularly shaped object does not have a length, width, or height that can be easily measured with a ruler. We need another way to measure the volume. To measure the volume of an irregularly shaped object, use the liquid displacement method. Fully submerge the object in a volume of water and see how much the water level rises. Every milliliter of water rise equals a volume of one cubic centimeter.
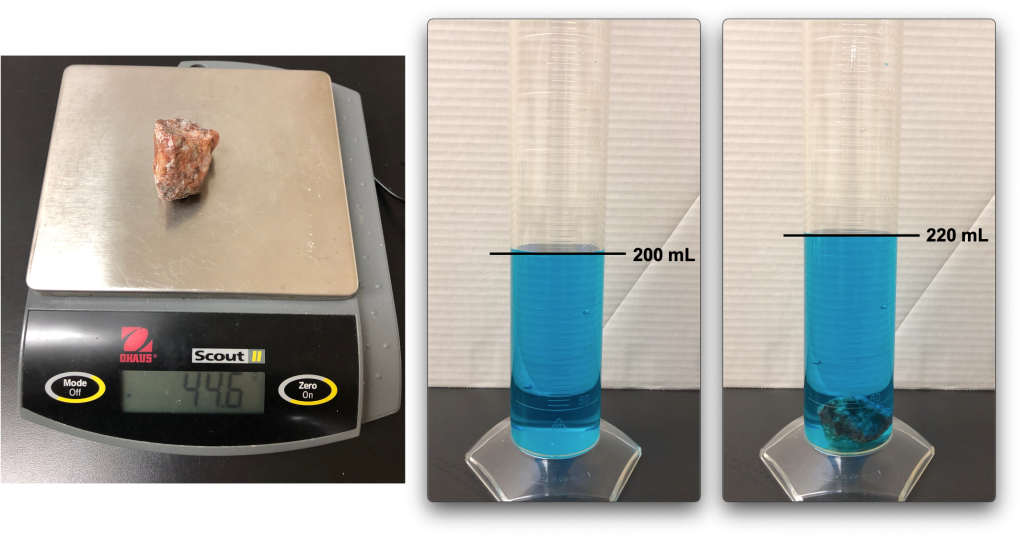
In Figure 12.4, the water displacement method is used to calculate the volume of a piece of granite. The mass is measured using a balance, and is 44.6 g (Figure 12.4, left). Then, the piece of granite is placed into a graduated cylinder with 200 mL of dyed water (Figure 12.4, middle) causing the water level to rise to 220 mL (Figure 12.4, right). The volume of the piece of granite is therefore 20 mL (20 cm3), and the density of the piece of granite is

Elasticity
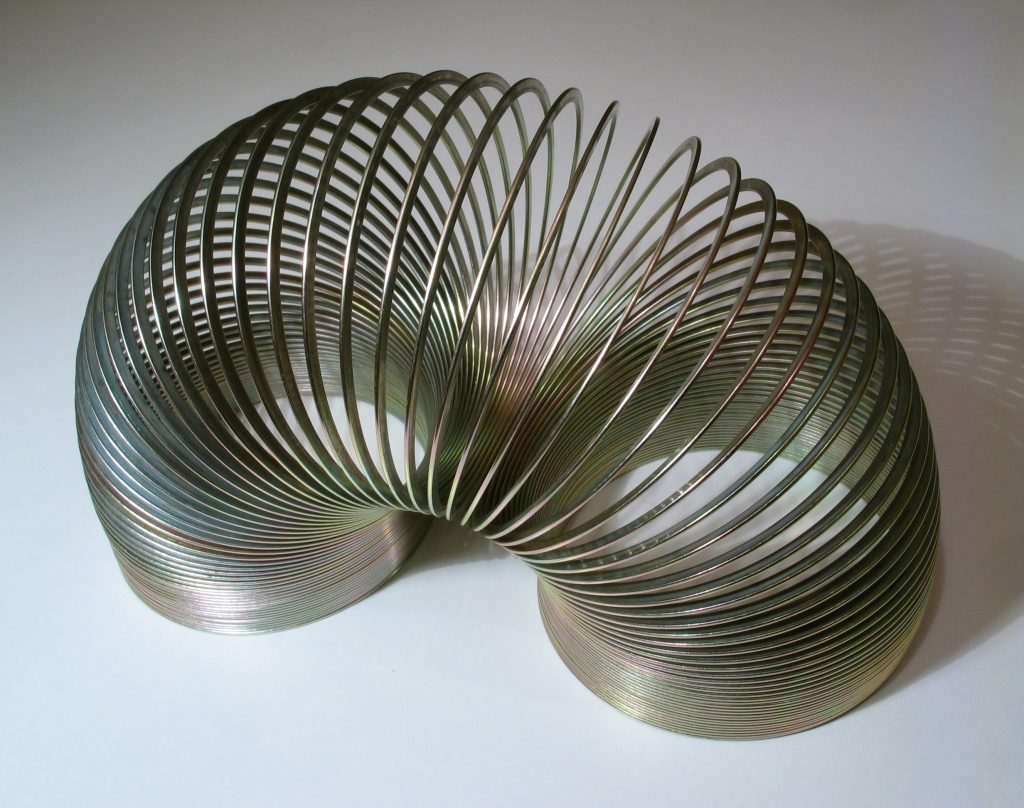
Elasticity describes how much an object deforms when experiencing a stress or force. If you’ve played with a SlinkyTM (Figure 12.5) before, you’ve probably seen this property. If a SlinkyTM is deformed by stretching it out lightly, once that force is removed, it will return to its original shape and configuration.
The application of force causes an object to deflect. When the force is removed, the object will go back to its original shape. However, if too much force is applied, then that object will no longer return to its original configuration. This happens when we exceed the yield strength of an object. If you’ve ever seen a spring that won’t quite go back to its coiled up position, then that spring has been stretched too far. A permanently deformed spring is shown in Figure 12.6.

Adding even more force will eventually cause an object to break. This happens when we exceed the ultimate strength of an object. Applying enough force will cause any elastic object to break: a SlinkyTM, a rubber band, or a spring.
Elasticity is defined mathematically for springs using Hooke’s law. Hooke’s law states that  , where F is the force applied to the spring and
  is the distance that the spring stretches as a result of that force. The variable represented by the lowercase letter k is called the spring constant. The unit of the spring constant is N/m (newtons per meter). You can think of the spring constant as describing the stiffness of the spring: the larger the spring constant, the more force that needs to be applied to make it stretch.
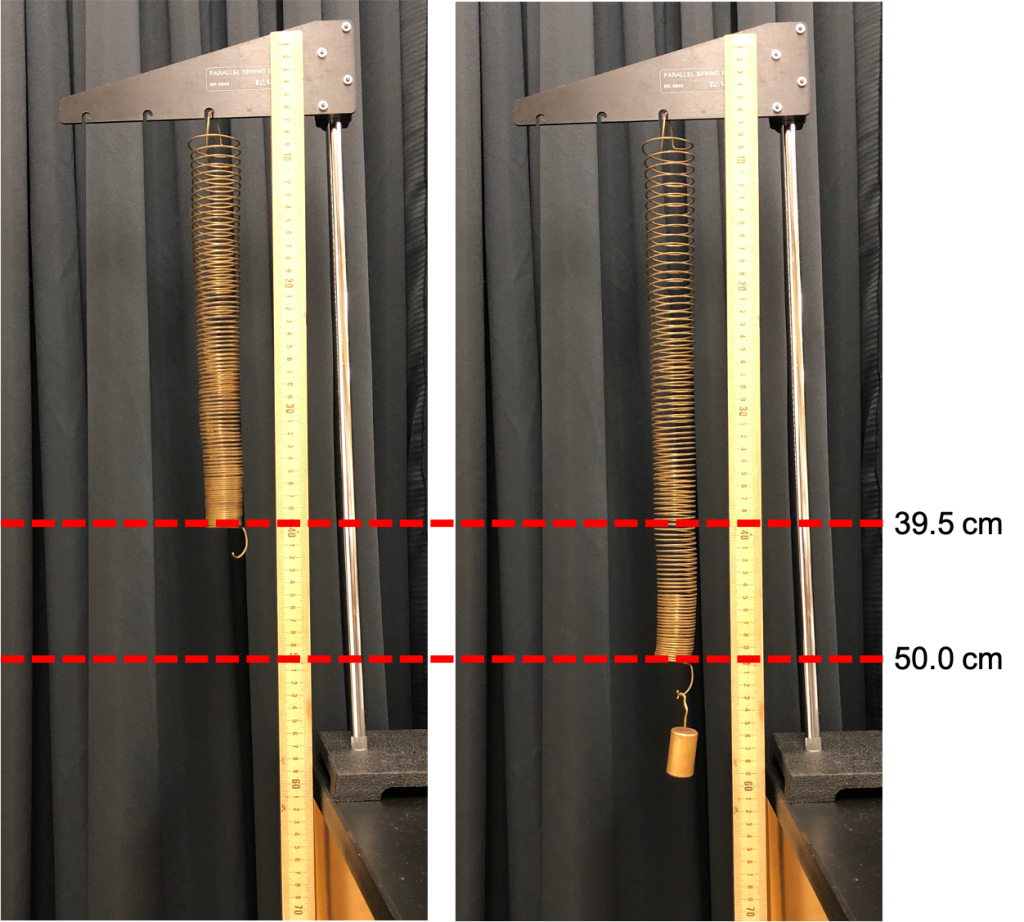
The spring shown in Figure 12.7 deflects 0.105 m (10.5 cm) when a mass of 0.1 kg (100 g) is placed on it. The weight of the mass is 1 N. The spring constant is therefore 9.52 N/m.
When springs are connected together, the overall spring constant may change. Springs can be connected in series such that the springs join together like one long line, each spring connected together end to end (see Figure 12.8, left). When a mass is placed on series springs, each spring will stretch out based on its spring constant, as both of the springs feel the full force of that mass.
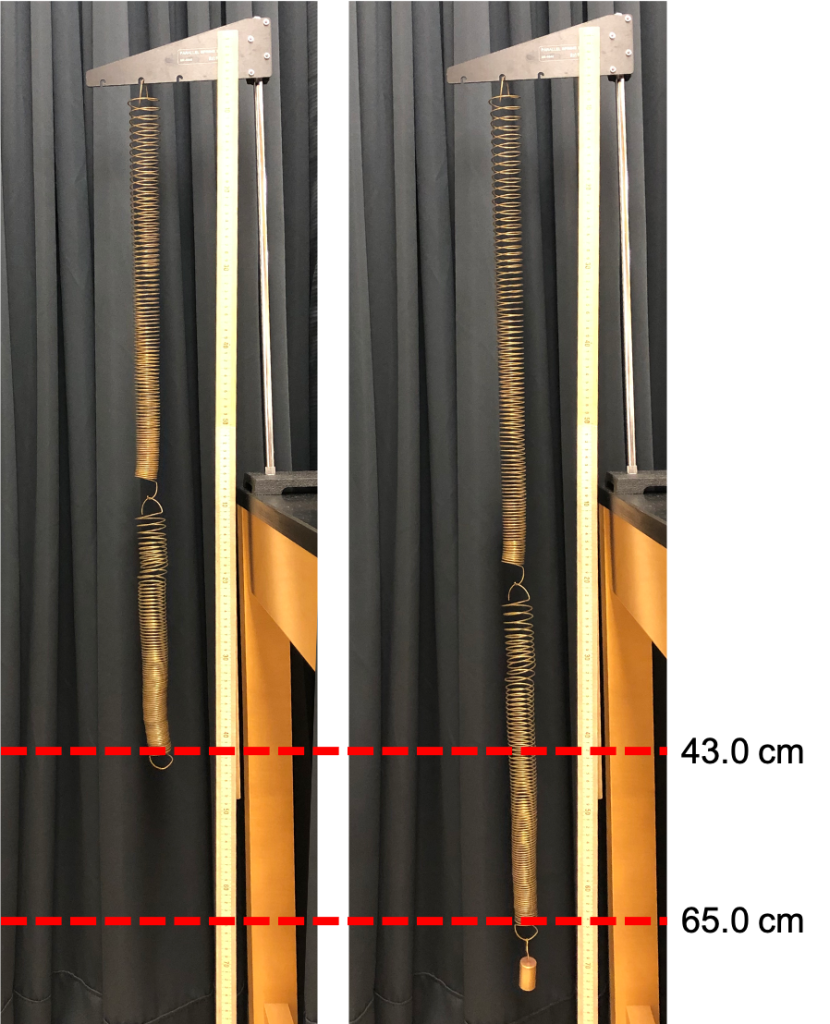
The series springs in Figure 12.8 deflect 0.22 m (22 cm) when a mass of 0.1 kg (100 g) is placed on them. The weight of the mass is 1 N. The spring constant of the series arrangement of springs is therefore 4.55 N/m. This is about one half the value for a single spring; the stiffness is reduced.
The effective spring constant of springs in series is smaller than the individual spring constants: the stiffness is lower because the spring combination stretches more than any one individual spring would stretch.
Springs can also be connected in parallel such that the springs join together side-by-side (see Figure 12.9, left). When a mass is placed on parallel springs, the force from that mass is distributed between both springs. Therefore they will stretch out less than they would do if they were individual or connected in series.
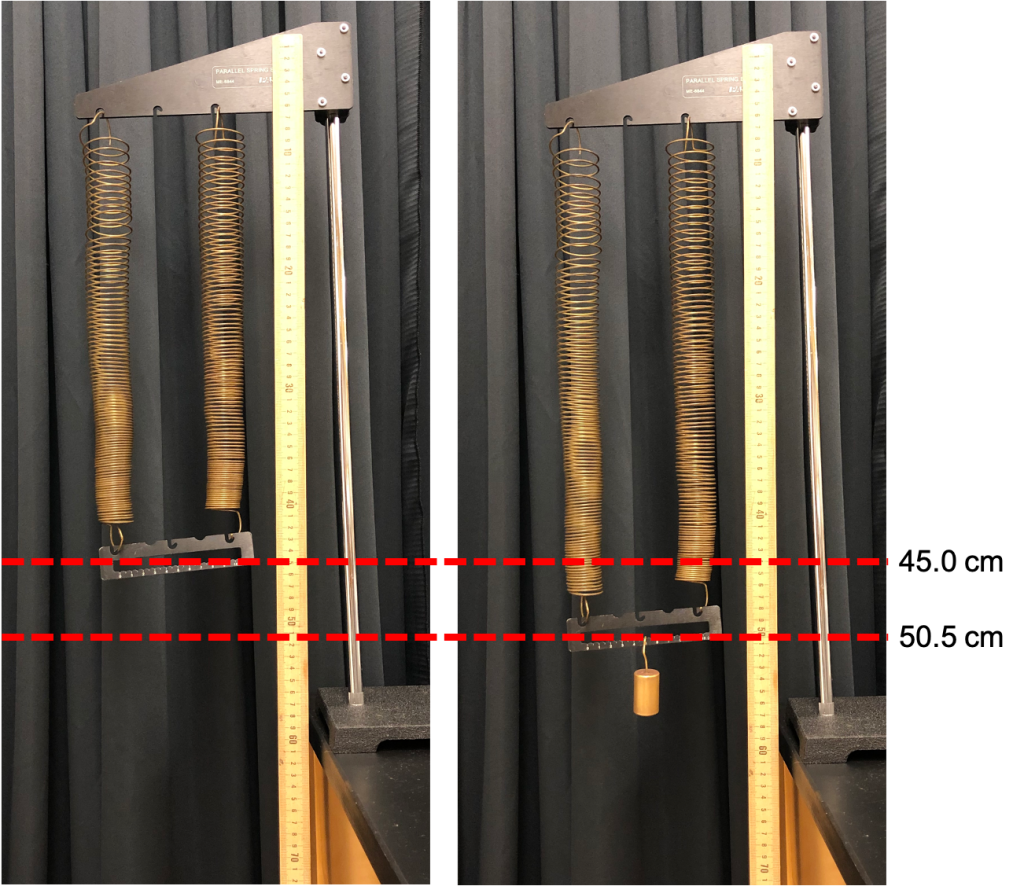
The parallel springs in Figure 12.9 deflect 0.055 m (5.5 cm) when a mass of 0.1 kg (100 g) is placed on them. The weight of the mass is 1 N. The spring constant of the parallel arrangement of springs is therefore 18.18 N/m. This is about double the value for a single spring; the stiffness is increased.
The effective spring constant of springs in parallel is larger than the individual spring constants: the stiffness is higher because the spring combination stretches less than any one individual spring would stretch.
Forces in solids
Solids are present in all aspects of our lives. As you read this book, you may be in a house or a building of some sort. That structure is built out of solid objects that are engineered to create a durable, robust building that does not move, even when people walk around in it, work in it, or when weather interacts with the outside of the building. How does that work?
All solid objects deflect to some degree when a force is placed on them. For example, the video below shows a meter stick. As Dr. Pasquale places masses on the meter stick, the meter stick deflects. When a lot of mass is placed on top, the meter stick bends noticeably.
When you stand on the floor, or when you sit in a chair, or when forces act on any solid object, those solids will deflect. The materials used in houses, chairs, tables, and other things that don’t visibly bend when we use them have been chosen because they don’t deflect much under the influence of the types of forces they will be subjected to. But just because we can’t see it, doesn’t mean it isn’t happening.
In the demo shown in the video below, a laser has been set up to reflect off of a mirror on the door frame and return to a solar panel. That solar panel is then connected to a speaker. The speaker emits noises any time the distance between the laser and the door frame changes, using a principle called interference that will be discussed later in this textbook. This interference principle is capable of detecting really small changes in distance.
When Dr. Fazzini pushes on the door frame, the speaker emits noises, indicating that the distance has changed. When he pushes on the door frame, the metal deflects. Dr. Fazzini has literally bent the wall by pushing on it! Thankfully, the deflection is small and the building stays upright.
The two major forces that act on solid objects are tension and compression. Tension is the force that exists when something is pulled or stretched apart. Compression is the opposite: it is the force that exists when something is pushed or squeezed together.
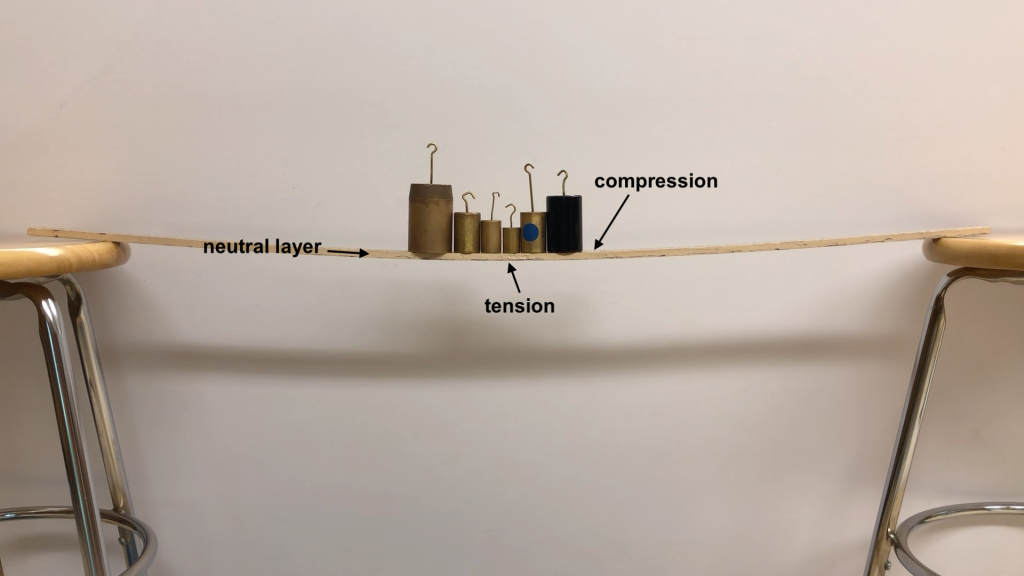
Going back to the meter stick example, when forces are placed on the meter stick and it deflects, the force causes the bottom of the meter stick to stretch out: that is a tension force. But the top of the meter stick is squeezed together: that is a compression force. This is shown in Figure 12.10. What happens in between the top and bottom of the meter stick? The region along the middle of the stick between the top and bottom of the stick is known as the neutral layer. There are no forces acting in this part of the meter stick.
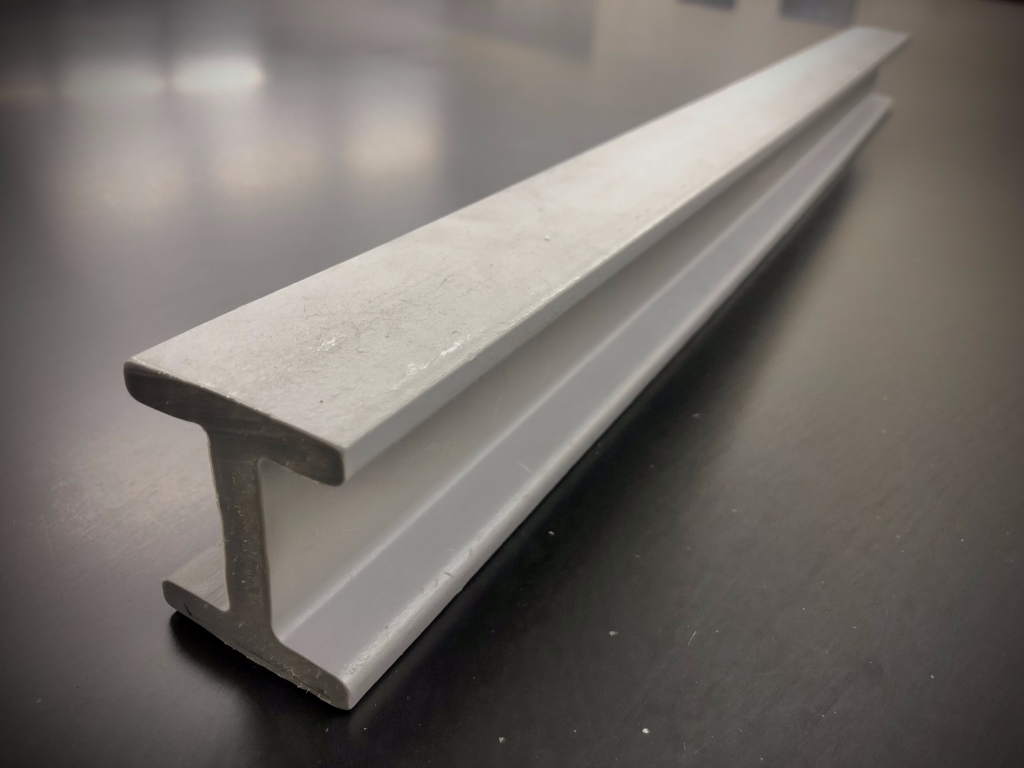
The presence of a neutral layer explains the design of I-beams. An I-beam (shown in Figure 12.11) is used in the construction of buildings. If an I-beam is bolted together at both ends, the forces of tension and compression will exist on the top and bottom if the beam is deflected (similar to the meter stick shown in Figure 12.10). Because the tension and compression forces don’t exist at the center of the beam, engineers can cut down on the construction materials used in this area. Notice that the top and bottom of the I-beam, which will be subjected to the most forces, have the most material present. In the center, where there are no forces, less material is needed, so the center is carved out. This reduces the cost and weight of the building materials. (The actual forces acting on an I-beam may be more complicated than this, but that discussion is beyond the scope of this textbook.)
Another place you may notice compression and tension forces is if you ever see an empty flatbed truck. Notice that the bed of the flatbed truck is curved upward (see Figure 12.12 for an example). When a heavy load of objects is placed on the flatbed, it deflects and becomes flat.

Scaling
Scaling has to do with the properties of a solid object and how they change when we make an object larger or smaller. This topic has a lot of important ramifications in chemistry, biology, and physics. The properties we are interested in are the surface area of the object, the volume of the object, and the weight of the object. We’ll measure these properties for a few cubes to come up with scaling parameters.
Cross-sectional area gives an indication of how strong an object is. If you’ve ever played sports or done weight training, you may have noticed your muscles increase in cross-sectional area as they become stronger. We can expect that an object with a larger cross-sectional area will be stronger than an object with a smaller cross-sectional area if all other things are kept equal.
Volume and density tell us how massive an object is, or how much it weighs when it is subject to the force of gravity.
Cross-sectional area divided by volume tells us how strong something is compared to its weight. This is an important concept from a structural standpoint. An object that is very strong but weighs a lot will be less structurally sound than something that has the same strength and weighs less. An ant is very strong: the cross-sectional area of an ant’s legs is small, but they have very little volume, so the cross-sectional area to volume ratio is rather high. When we look at larger insects and animals, we see that the larger an animal is, the larger the cross-sectional area of its supporting limbs to support their weight. An elephant has very thick legs to keep the cross-sectional area to volume ratio high enough for the elephant to be able to walk around.
Simply increasing the volume of an object (such as an ant) will cause the volume of the ant to increase much more rapidly than the cross-sectional area. From a structural standpoint, this means that we cannot simply make things larger and expect them to be as structurally sound. An ant, blown up to the size of an elephant, would not be able to support its own weight. Sci-fi movies featuring giant spiders destroying cities are getting physics wrong: those giant insects would have a very small cross-sectional area to volume ratio, making those giant insects completely unable to move!
Another important factor in scaling is the total surface area to volume ratio. This has many important applications in heating, chemical reactions, and biology. As an object is scaled up to become larger and larger, the surface area divided by volume ratio will change.
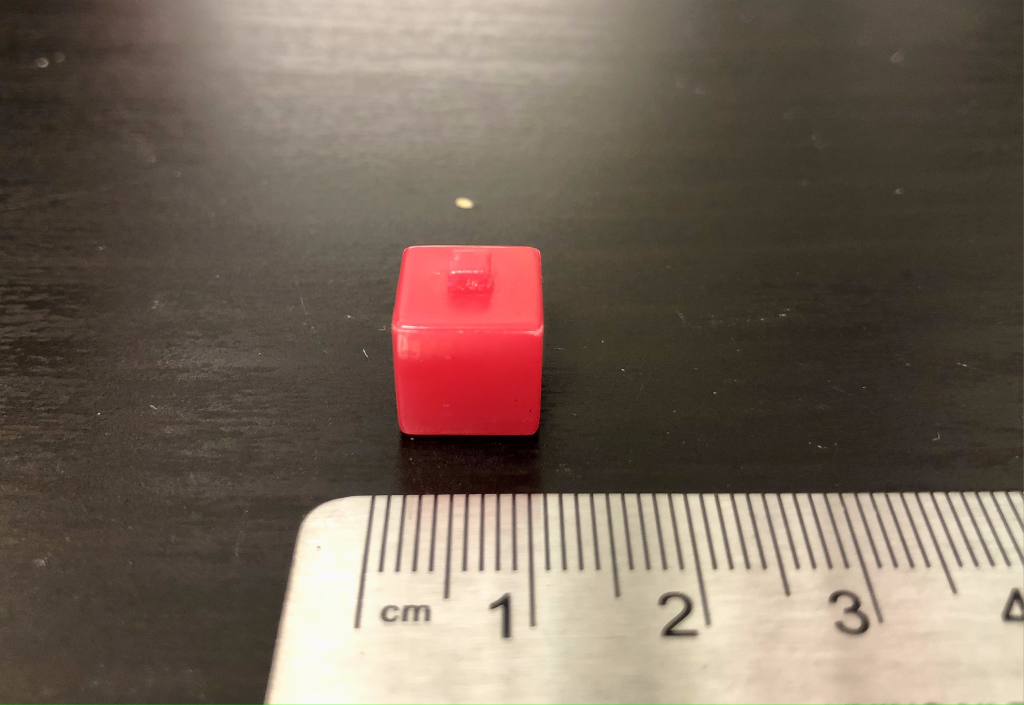
A cube that measures 1 cm by 1 cm by 1 cm (Figure 12.13) has six faces each with a face area of 1 cm2. The total surface area is therefore 6 cm2. The volume of the cube is length times width times height: 1 cm3. The surface area to volume ratio is 6 cm-1 (inverse centimeters).
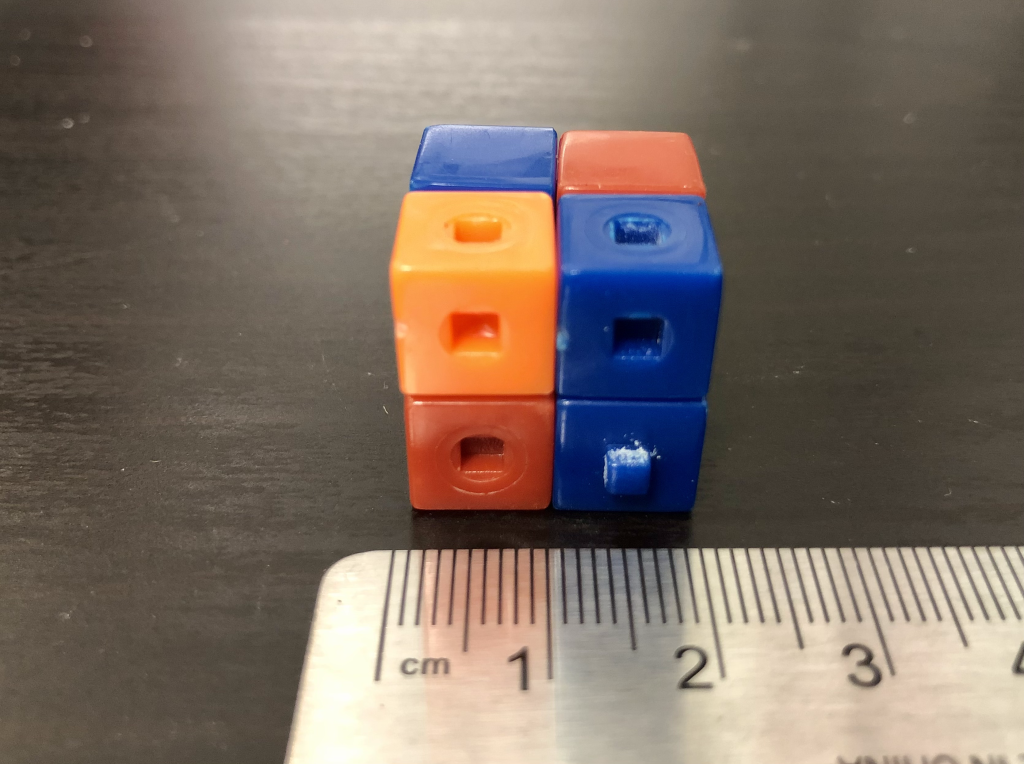
Suppose this cube goes into a magical machine that maintains its properties (such as density) but simply scales it up to have a size of 2 cm by 2 cm by 2 cm (Figure 12.14). Each face has an area of 4 cm2, so this new cube has a total surface area of 24 cm2. That’s much bigger than before! But now the volume has increased to 8 cm3, making the surface area to volume ratio a mere 3 cm-1, which is smaller than the previous case.
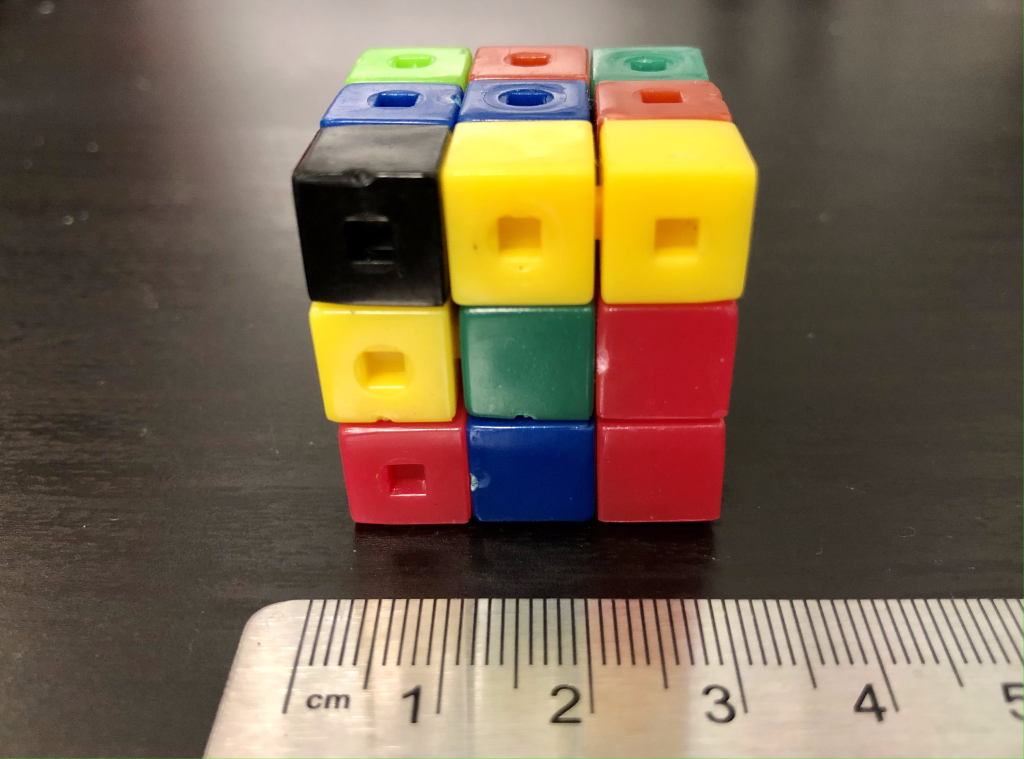
Suppose the cube becomes even larger: 3 cm by 3 cm by 3 cm (Figure 12.15). The area of each face is 9 cm2, and the total surface area is 54 cm2. The volume is 27 cm3, so the surface area to volume ratio is 2 cm-1.
As the cube continues to become larger and larger, the surface area will continue to increase, but it does not increase as fast as the volume. A cube with an edge length of  centimeters (where can be any number we choose) will have a surface area of
  , a volume of
  , and a surface area to volume ratio of
  . The larger becomes, the smaller the surface area to volume ratio. This data is outlined in the table below for cubes of various edge lengths.
|
edge length (cm) |
face area (cm2) |
total surface area (cm2) |
volume (cm3) |
surface area to volume ratio (cm-1) |
|
1 |
1 |
6 |
1 |
6 |
|
2 |
4 |
24 |
8 |
3 |
|
3 |
9 |
54 |
27 |
2 |
|
4 |
16 |
96 |
64 |
1.5 |
|
5 |
25 |
150 |
125 |
1.2 |
|
x |
x2 |
6x2 |
x3 |
6/x |
Surface area matters in chemistry, biology, and other related fields. Consider a biological cell. As a cell becomes larger in volume, it requires more nutrients. But nutrients can only be absorbed through the cell wall, which is only as large as the surface area. At a certain point, if a cell becomes too big, it cannot obtain enough nutrients or other chemicals to carry out its functionality. Instead of becoming larger and larger, cells divide. This keeps the surface area to volume ratio sufficient for cells to continue to survive.
Surface area also plays a large role in heat transfer. Many computer processors have a heatsink placed over the processor (see Figure 12.16). As you browse the internet, play games on your computer, or write up an essay for your English class, the computations that your computer performs cause the processor to heat up. That heat is then dissipated through the heatsink, which turns on a fan to blow cooling air over the system and keep things from melting.

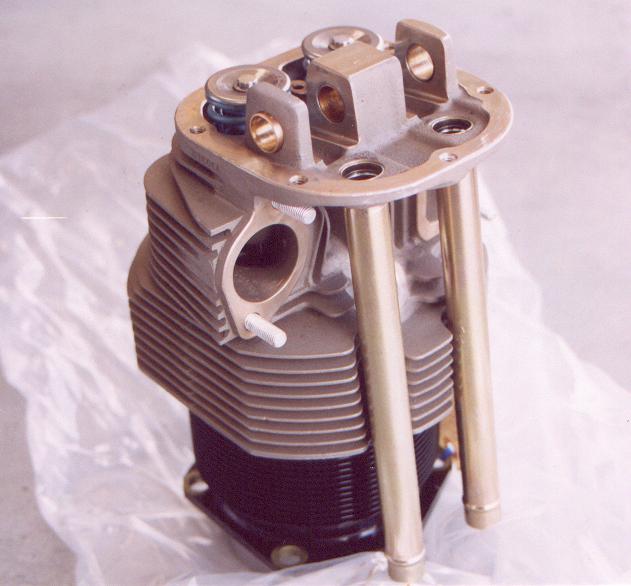
A heatsink that uses airflow to dissipate heat usually has a large surface area. The more surface area there is, the easier it is for heat to get transported away. You also see this in air-cooled cylinders in airplane engines or motorcycles, among other things. An air-cooled airplane engine cylinder shown in Figure 12.17 has the characteristic cooling fins of a heatsink.
As a final example, consider the video shown below. In this demo, Dr. Pasquale has a tin plate covered with lycopodium powder. This is a dry powder that is also very flammable. When she tries to ignite the lycopodium powder, she has a hard time doing so. Only a little bit of the powder burns before the fire goes out. This is because there is very little surface area available to combust with the surrounding fire and oxygen.
When Dr. Pasquale instead blows individual lycopodium powder into an open flame, the result is that the lycopodium powder explodes. By exposing more of the surface area, the chemical reaction is more readily enabled, and we can see that very dramatically in this example. The two outcomes are shown in Figure 12.18.

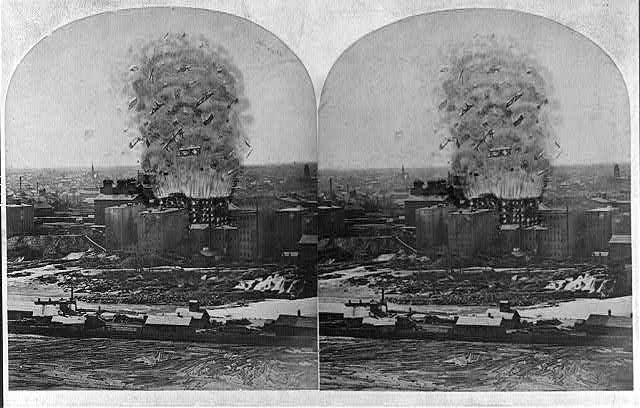
Chemical reactions will be more vigorous when the reactants have more surface area than when they have less. This is true for experiments in test tubes as well as in fires. Grain elevators are at risk of explosion after grains have been newly introduced, stirring up lots of particles and exposing a lot of surface area. If any sparks occur during these times, grain elevators can explode. A stereograph of a grain elevator explosion that occurred in 1878 is shown in Figure 12.19.
Further reading
- PhET Hooke’s law simulation – Play with this simulation to explore Hooke’s law for single springs, series springs, and parallel springs.
Practice questions
Conceptual comprehension
- What would happen if the bed of a flatbed truck started out flat, and then deflected downward when a heavy load was placed on top?
Numerical analysis
- An object has a mass of 50 g (0.05 kg) and measures 0.02 m3 (20,000 cm³). Calculate its density. Use units of g/cm3 and then re-calculate with units of kg/m3.
- An irregularly shaped stone has a mass of 750 g (0.75 kg) and displaces 0.0004 m3 (400 cm³) of water when submerged. Calculate its density. Use units of g/cm3 and then re-calculate with units of kg/m3.
- A wooden cube has a mass of 20 g (0.02 kg) and each edge of the cube measures 3.3 cm. First, calculate the volume of the cube. Then, calculate its density. Use units of g/cm3 and then re-calculate with units of kg/m3.
- A spring has a spring constant of 200 N/m. If a force of 50 N is applied to the spring, how much will it stretch?
- A spring with a spring constant of 300 N/m is stretched out a distance of 0.1 meters. Calculate the force required to stretch it.
- A spring is stretched by 0.05 meters when a force of 25 N is applied. Calculate the spring constant.
- Suppose you have two identical springs in series. Each spring has a spring constant of 30 N/m. If a force of 5 N is applied to the combination of these two springs, what will be the total distance that the springs will stretch?
- Suppose you have two identical springs in parallel. Each spring has a spring constant of 30 N/m. If a force of 5 N is applied to the combination of these two springs, what will be the total distance that the springs will stretch?
- A small cube has sides measuring 4 centimeters each. If you scale it up proportionally to create a larger cube (with equal density), and the sides of the larger cube are now 12 centimeters each, calculate the…
- …total surface area of the new cube.
- …volume of the new cube.
- …surface area to volume ratio of the new cube.
Hands-on experiments
- Find a few irregularly shaped objects (like stones or pebbles) and a measuring cup. Fill the measuring cup with water and record the initial water level. Carefully add the objects one by one, recording the new water level each time. Calculate the volume of each object by subtracting the initial water level from the final water level. If you have a scale to measure mass, calculate the density using the mass and volume of each object.
A solid is a substance where the molecules or atoms are very tightly bound together. This gives a solid a very rigid volume and shape. Solid is one of the four most common phases of matter.
A crystalline solid has constituent atoms or molecules that are arranged in an orderly, repeating manner.
Amorphous solids have atomic or molecular arrangements that are spatially disordered, or that otherwise lack a regular periodic arrangement.
Density describes the compactness of matter in a substance, defined as the mass per unit volume. (symbol: D, unit: kg/m^3)
Physics is a branch of science that focuses on the fundamentals of the workings of our universe.
Mass is a property of physical objects that relates to resistance to changes in motion: inertia. (symbol: m, unit: kg)
A force is a push or a pull that causes an object to change its motion. More fundamentally, force is an interaction between two objects. (symbol: F, unit: N)
In a pure substance, the properties of a substance (density, melting point, specific heat capacity, etc.) are inherent to the material.
An element is a substance that consists of atoms whose nuclei have the same atomic number. An element cannot be broken down further by chemical means.
A liquid is a state of matter in which the constituent molecules will change their shape or arrangement but cannot be easily compressed to change their volume. Liquid is one of the four most common phases of matter.
Elasticity describes how much an object deforms when experiencing a stress or force.
The spring constant defines the stiffness of an elastic object such as a spring. The spring constant is equal to the force required to deflect a spring a certain distance. (symbol: k, unit: N/m)
The weight of an object is proportional to its mass as well as the force of gravity acting on that object, related by Newton's second law. More accurately, weight arises due to a supporting force acting on the object.
Interference is the phenomenon that occurs when two waves overlap. The total amount of wave energy present at a point is equal to the sum of each individual wave's energy at that point.
Tension is the force that exists when something is pulled or stretched apart.
Compression is the force that exists when something is pushed or squeezed together.
Gravity is the attractive force experienced by objects of mass. It is one of the four fundamental forces.
Heat is energy that is transferred from one object to another in response to a difference in temperature. (symbol: Q, unit: cal)
Melting is the phase change that occurs when a substance converts from a solid to a liquid.
