38 N America: Cultural Geography II – Religion in the United States (part 2)
Shifting Demographics in American Religion
 The religious denominations showing the steepest declines in their overall share of the American population have been the Mainline Protestant churches. Once the dominant force in American religious life, their position has eroded steadily over the last fifty years. Not all of them are experiencing a decline in absolute numbers, but none are growing faster than the overall American population. There are four major reasons for this. First, every decade sees a slight uptick in America’s non-religious population, and many of these Americans come from families that have been members of the Mainline denominations. Second, the number of Americans attending non-denominational churches has soared in recent decades, and many of those attendees have “emigrated” from the Mainline churches. Third, many Mainline Protestants are from white, middle-class America, a group that has relatively low birth rates, so each generation of Mainline Protestants is the same size, and sometimes smaller, than the generation before it. Finally, much of America’s population growth in recent decades has come from immigration, and very few immigrants are Lutheran, Methodist, Presbyterian, or Episcopalian.
In recent decades, the number of non-denominational Protestants has grown rapidly, as has the number of non-religious Americans. Other fast-growing religious groups in America include Muslims, Buddhists, and Hindus, largely because of increased immigration from Asia.
Both Jews and Roman Catholics have seen their share of the American population hold relatively steady. Jews in America are demographically similar to Mainline Protestants – with low birth rates, low rates of immigration, and a decrease in religious participation among younger people. That said, because the surveys that supply us with these percentages are based on identity, not activity, a good number of non-practicing Jews still identify as Jewish, because it is an ethnic identity as well as a religious one.
Many Americans would be surprised to find that the number of Catholics in the United States is holding steady, but they would be surprised for different reasons, depending on what part of the country they’re from. In some areas, the number of Catholics is declining. This is due, in part, to the slow but steady decline in the number of Americans who identify as religious. This trend has been exacerbated in the Catholic Church by long-standing and sometimes bitter debates over the Church’s policies on abortion, birth control, female clergy, and gay parishioners. The abuse scandals that rocked the Church over the last two decades certainly haven’t helped.
A counterbalance to this trend has been immigration. The single largest source of immigrants to the United States for the last half-century has been Latin America, an overwhelmingly Catholic region. Put simply, in regions of the country that have seen significant immigration from Latin America (or from other Catholic countries, like Poland or the Philippines), the Catholic Church has been growing. In places that have not received such immigrants, the number of Catholics is declining. Interestingly, these two dynamics have balanced out nationally, and the percentage of Americans who are Catholic has stayed about the same.
Spatial Dynamics of American Religion
As we saw on the earlier chapter addressing part 1 of this topic, the webpage https://www.washingtonpost.com/blogs/govbeat/wp/2013/12/12/religion-in-americas-states-and-counties-in-6-maps/ shows the largest religious group in each American county as of 2010. It is a little misleading, as many maps of this type are. It suggests the overwhelming dominance of a particular group across wide swaths of the map. In reality, most of the country is religiously diverse. There are Baptists in Boston, and Catholics in Mississippi. You’ll find Muslim mosques in the Missouri Ozarks, and Hindu temples in Salt Lake City. In large metropolitan areas like Chicago, you can find just about every religious denomination you could imagine.
With that map open, examine the colors and patterns of the highlighted religious denominations. Certain groups are pretty strongly represented in certain areas. One of the most striking is the prevalence of Baptists in the U.S. South (red on the map). Another that is not quite as obvious, but still noticeable, is the preponderance of Methodists across the lower Midwest (green). One reason for the distribution of these two groups was the nature of religion on the American frontier. Two of the largest religious groups in colonial America were Anglicans (later to be Episcopalians) and Catholics. Both of these churches have strict rules about who can be a priest, and how a parish is established. As Americans moved west of the Appalachians, these churches were ill-equipped for a fast-moving, inaccessible, and disorganized frontier. The Methodists and Baptists had, at least then, far less strict rules about who could establish a church and preach there. As such, these denominations were better equipped to move with the frontier, and quickly became the dominant groups in the South and lower Midwest.
Two years later the Washington Post expanded their coverage of the geographic distribution of the religious faithful in the United States. Look at the different maps here to see these patterns. https://www.washingtonpost.com/blogs/govbeat/wp/2015/02/26/the-religious-states-of-america-in-22-maps/
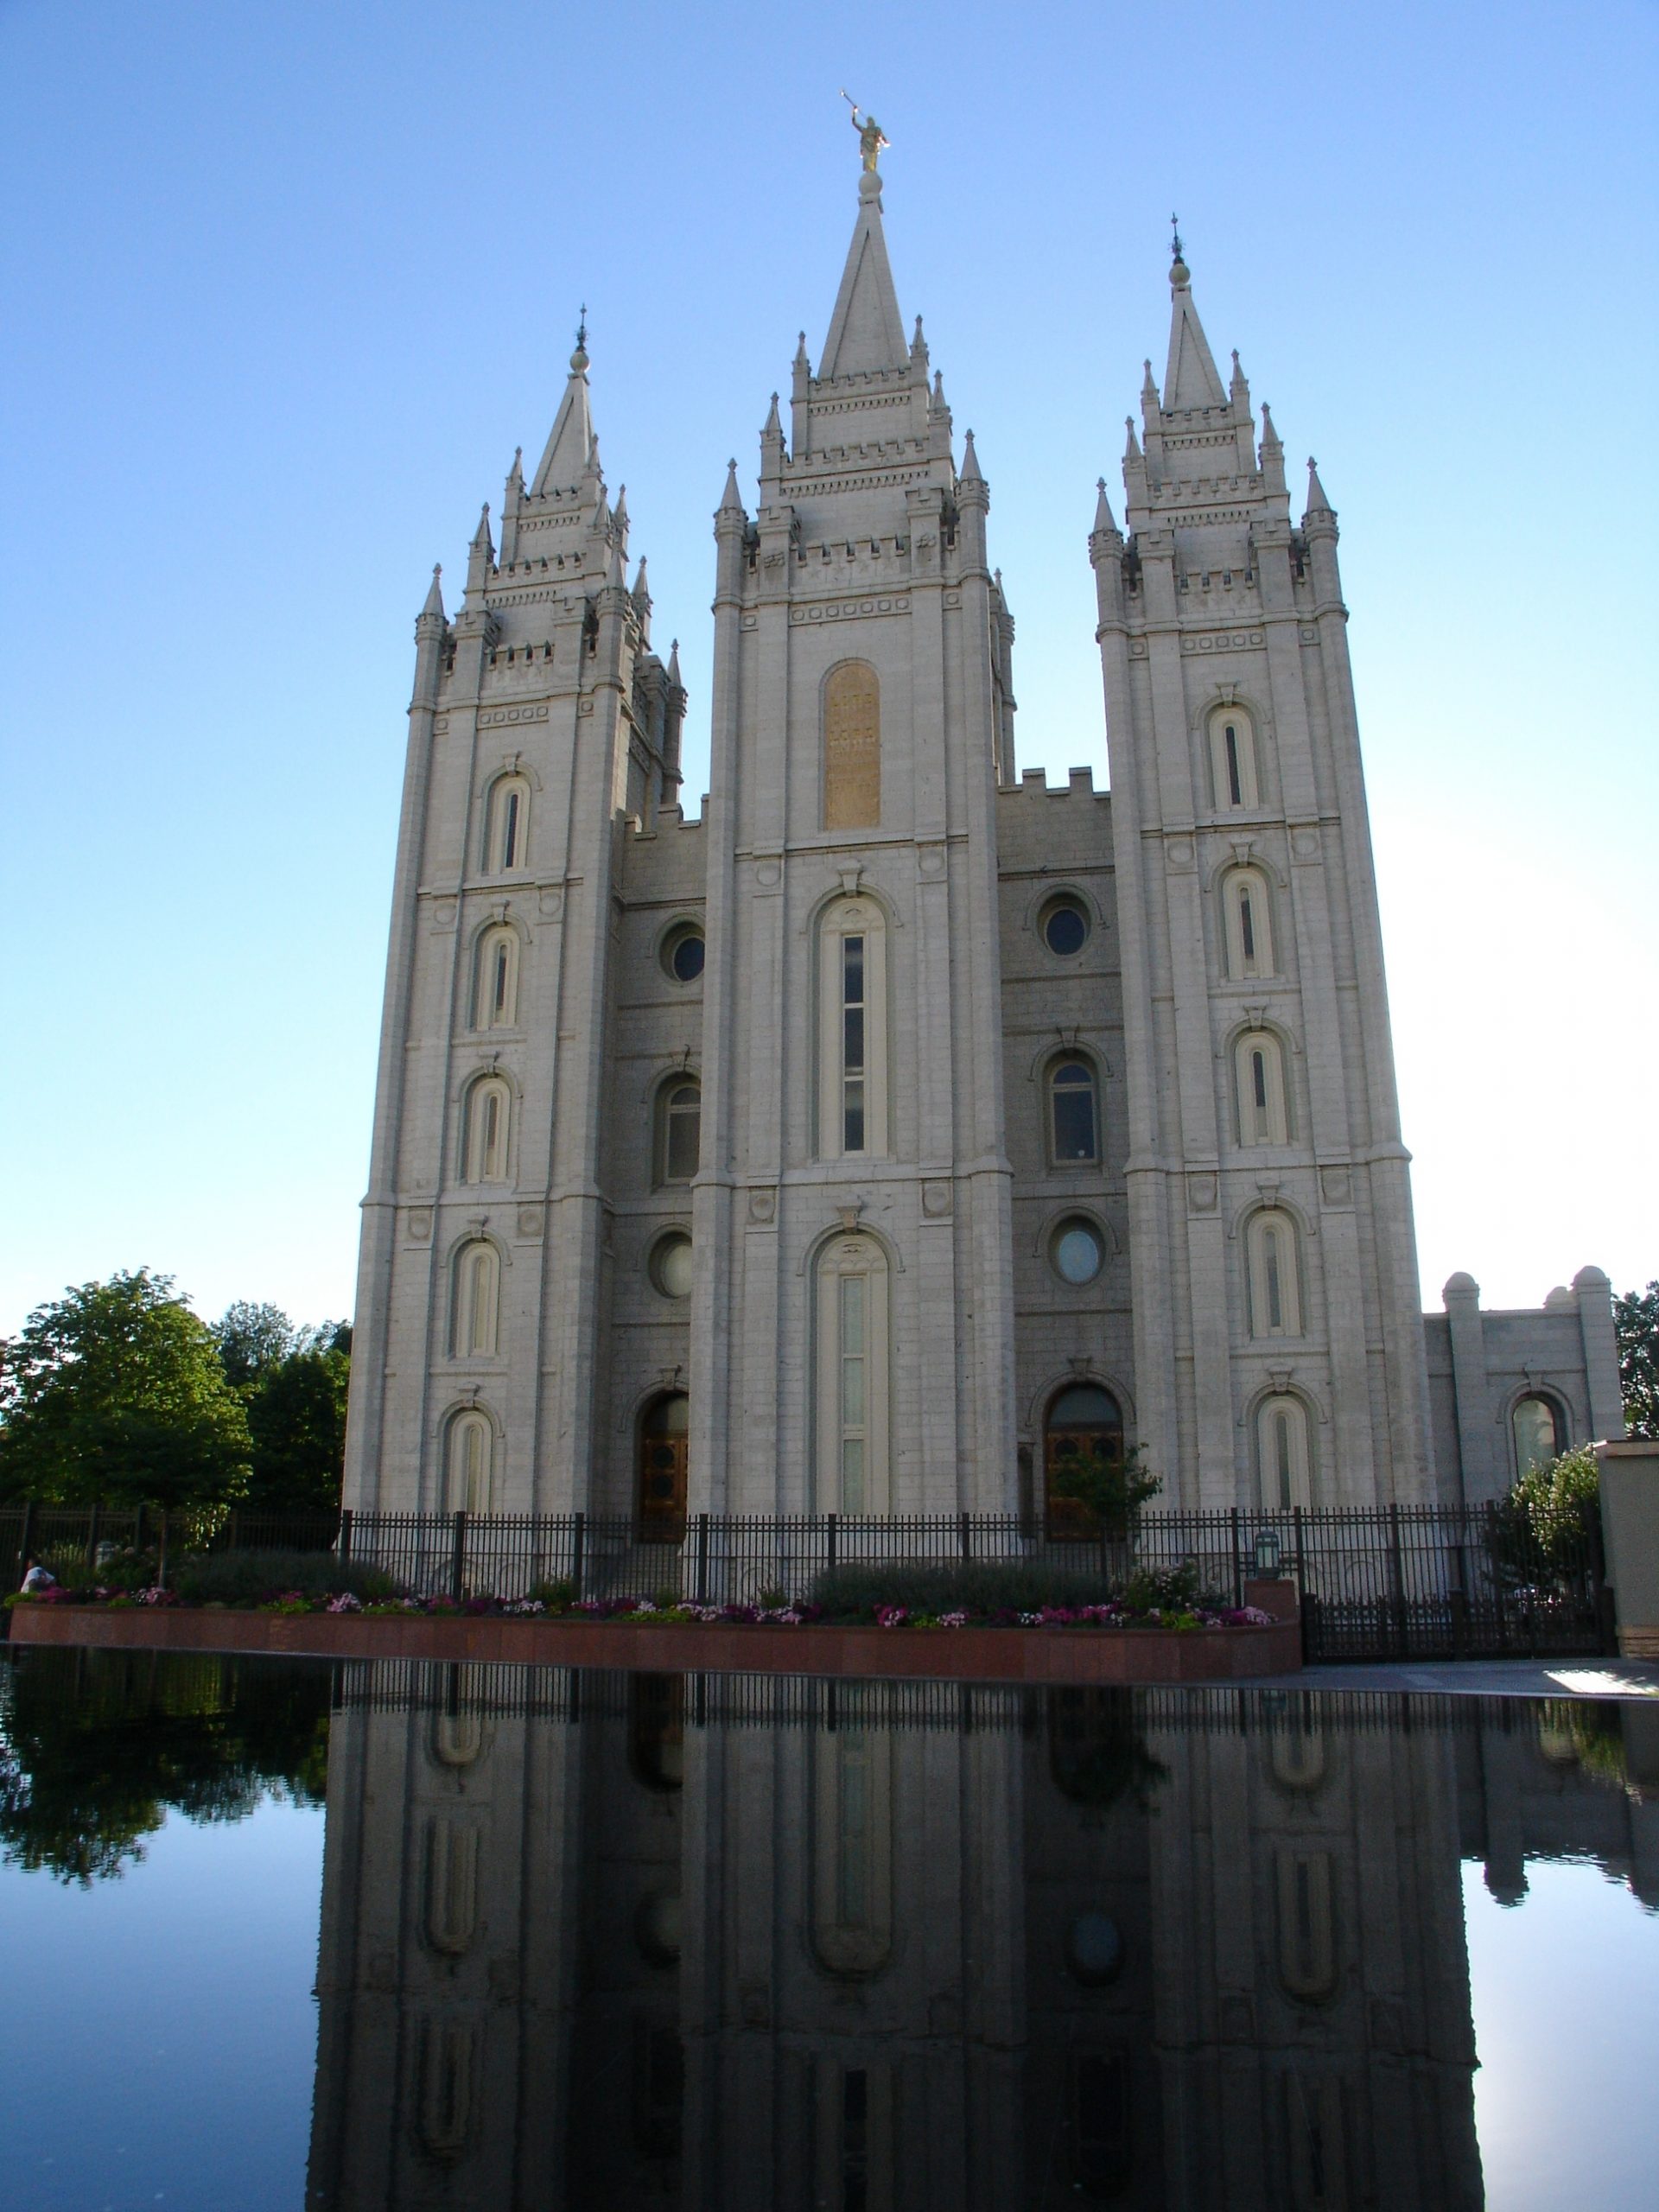
The rest of America’s religious geography is also a story of migration. The orange areas on the map in the upper Midwest represent Lutherans, which is the result of historic immigration from Scandinavia and northern Germany. In Chapter 30, you read about the migration of Mormons to Utah (gray on the map), from where they fanned out to dominate much of the Great Basin. The blue color on the map indicates the Catholic Church. German-Americans are the largest ethnic group in the United States, and many German immigrants to the U.S. were Catholic. That explains much of the geography of Catholicism in the U.S., particularly in places like Pennsylvania, Wisconsin, Illinois, and Michigan, which have especially large German-American populations. Many of the rest of the Catholic areas on the map are the result of immigration from other Catholic countries – think of the large of number of Irish-Americans in Boston, Italian-Americans in New York, Polish-Americans in Chicago, Cuban-Americans in Miami, French-Americans in New Orleans, and Mexican-Americans throughout the southwest.
Cited and additional bibliography:
Jason. n.d. Mormon Temple. Accessed June 9, 2020a. https://tinyurl.com/mormontempleslc. Attribution-NonCommercial-NoDerivs 2.0 Generic (CC BY-NC-ND 2.0).
