42 N America: Political Geography II – The Electoral College & Swing States

In most elections, the winner is determined by the popular vote. The popular vote is the sum of all ballots cast by voters in an election. The word “popular,” in this sense, refers to population. The popular vote is the people’s vote. Senators, congressional representatives, governors, and nearly every other elected official in the United States is selected by popular vote. There is one major exception. Americans elect a president every four years, and it is possible for a candidate to win the popular vote, but lose the election. This has happened four times in American history, most recently in 2016, when Hillary Clinton received nearly three million more votes than Donald Trump. Trump, however, won the election because he was victorious in the electoral college. For a terrific dot-density map of the election results, go to https://carto.maps.arcgis.com/apps/webappviewer/index.html?id=8732c91ba7a14d818cd26b776250d2c3
The electoral college is a group of people chosen by voters to elect the president. Here’s how it works: Each state is assigned a certain number of electoral votes. The distribution of electoral votes is determined by congressional representation, with each state receiving one electoral vote for every member who represents them in Congress. There are 100 members of the U.S. Senate, and 435 members of the House of Representatives, for a total of 535. The District of Columbia has no representation in Congress, but is constitutionally allotted three electoral votes, bringing the total number of electors to 538.
Illinois, for example, has two senators and eighteen representatives, so it is allotted twenty electoral votes. California has the most electoral votes, with fifty-five. Since each state has two senators and at least one representative, the minimum number of electoral votes a state is allotted is three. Alaska, Montana, Wyoming, North Dakota, South Dakota, and Vermont (along with D.C.) are each are allotted the minimum. The candidate who accumulates more than half of the electoral votes, at least 270, wins the presidential election.
The states’ electoral votes are, with few exceptions, winner-take-all. If a presidential candidate wins Illinois by a million ballots, they receive all twenty of the state’s electoral votes. If a presidential candidate wins Illinois by one ballot, they still receive all twenty of the state’s electoral votes. The margin of victory doesn’t matter.
Only two states – Maine and Nebraska – are not winner-take-all. In those states, the winner of the overall popular vote automatically receives two electoral votes. The remaining electoral votes are assigned based on which candidate wins in each congressional district. In 2016, Hillary Clinton won in Maine, but lost one of its two congressional districts, so she received three of Maine’s electoral votes, while Donald Trump received one.
The winner-take-all nature of the electoral college means that a handful of states, known as swing states, receive nearly all of the attention during presidential campaigns. A swing state is a state where presidential elections tend to be relatively close. Because of that, these states have a tendency to “swing” from one party to the next over the course of a few elections. Presidential candidates tend to pour most of their time and money into swing states, since they are key in determining the outcome of an election.
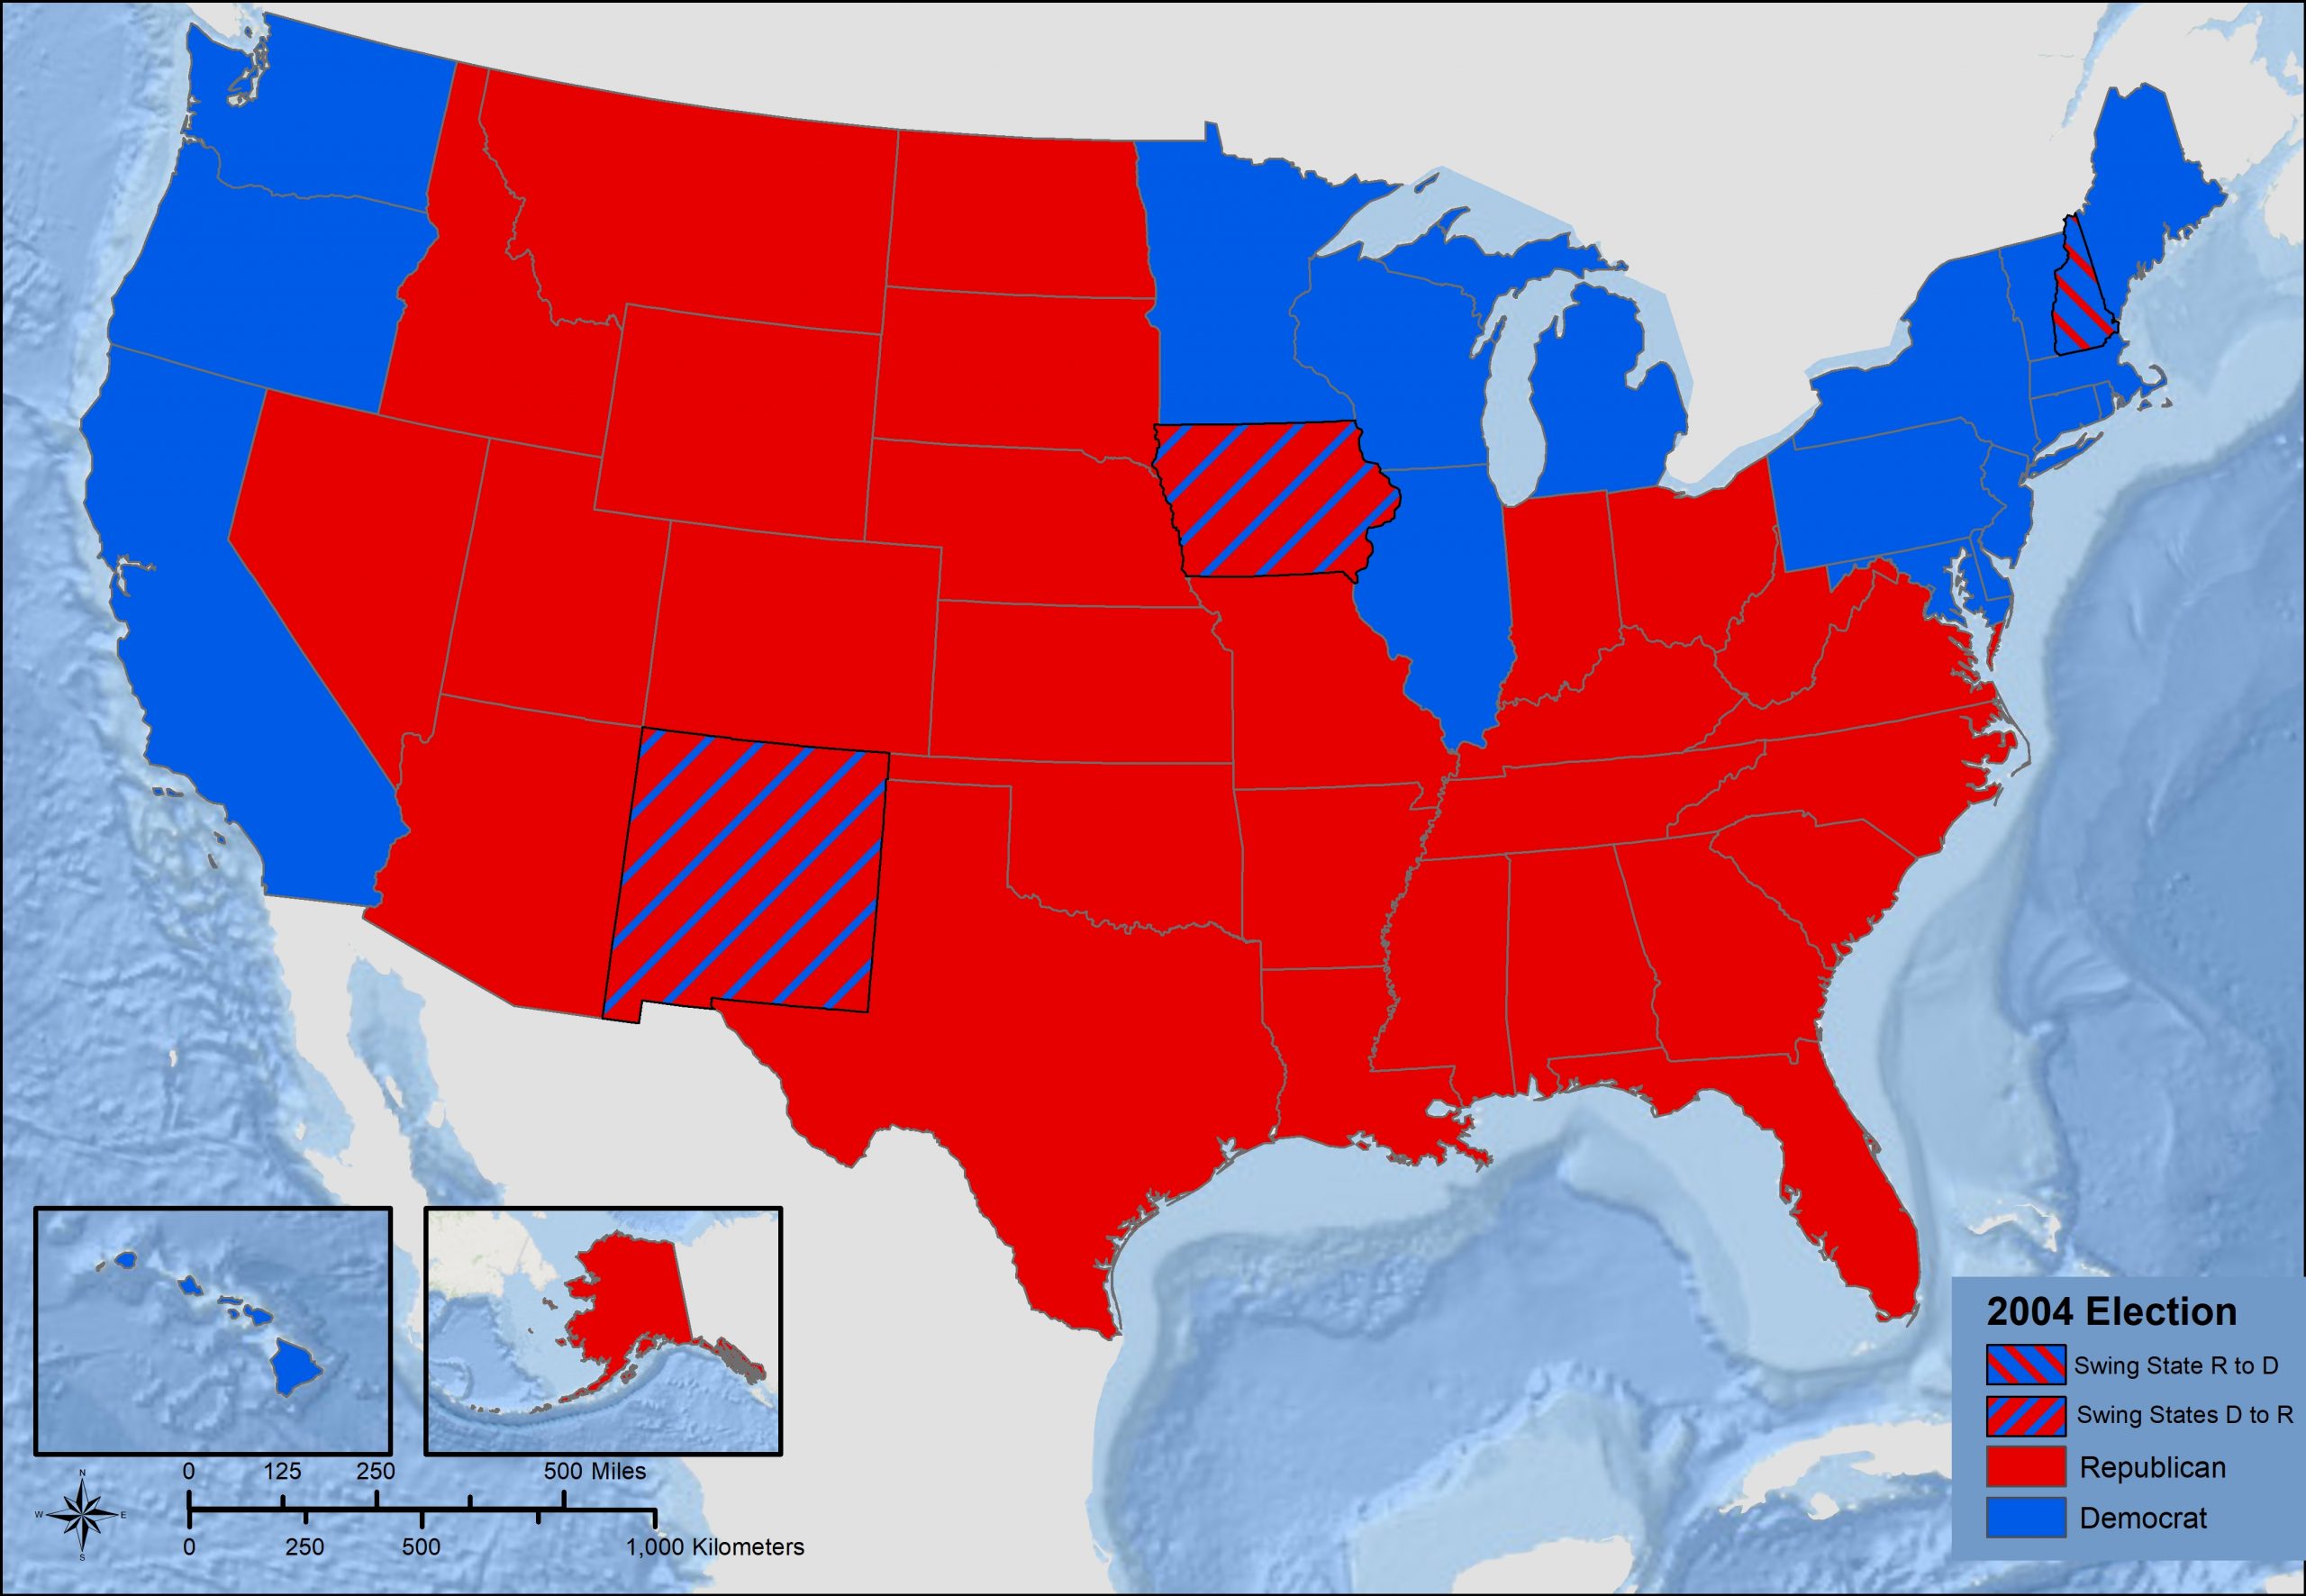
To better understand swing states, we’ll look briefly at the last four presidential elections. In 2004, President George W. Bush, a Republican, was running for reelection against Senator John Kerry, a Democrat. Senator Kerry won several states that were rich in electoral votes, such as New York, Pennsylvania, Illinois, and California, but it was not enough to overcome President Bush, who won the electoral college 286 to 251.
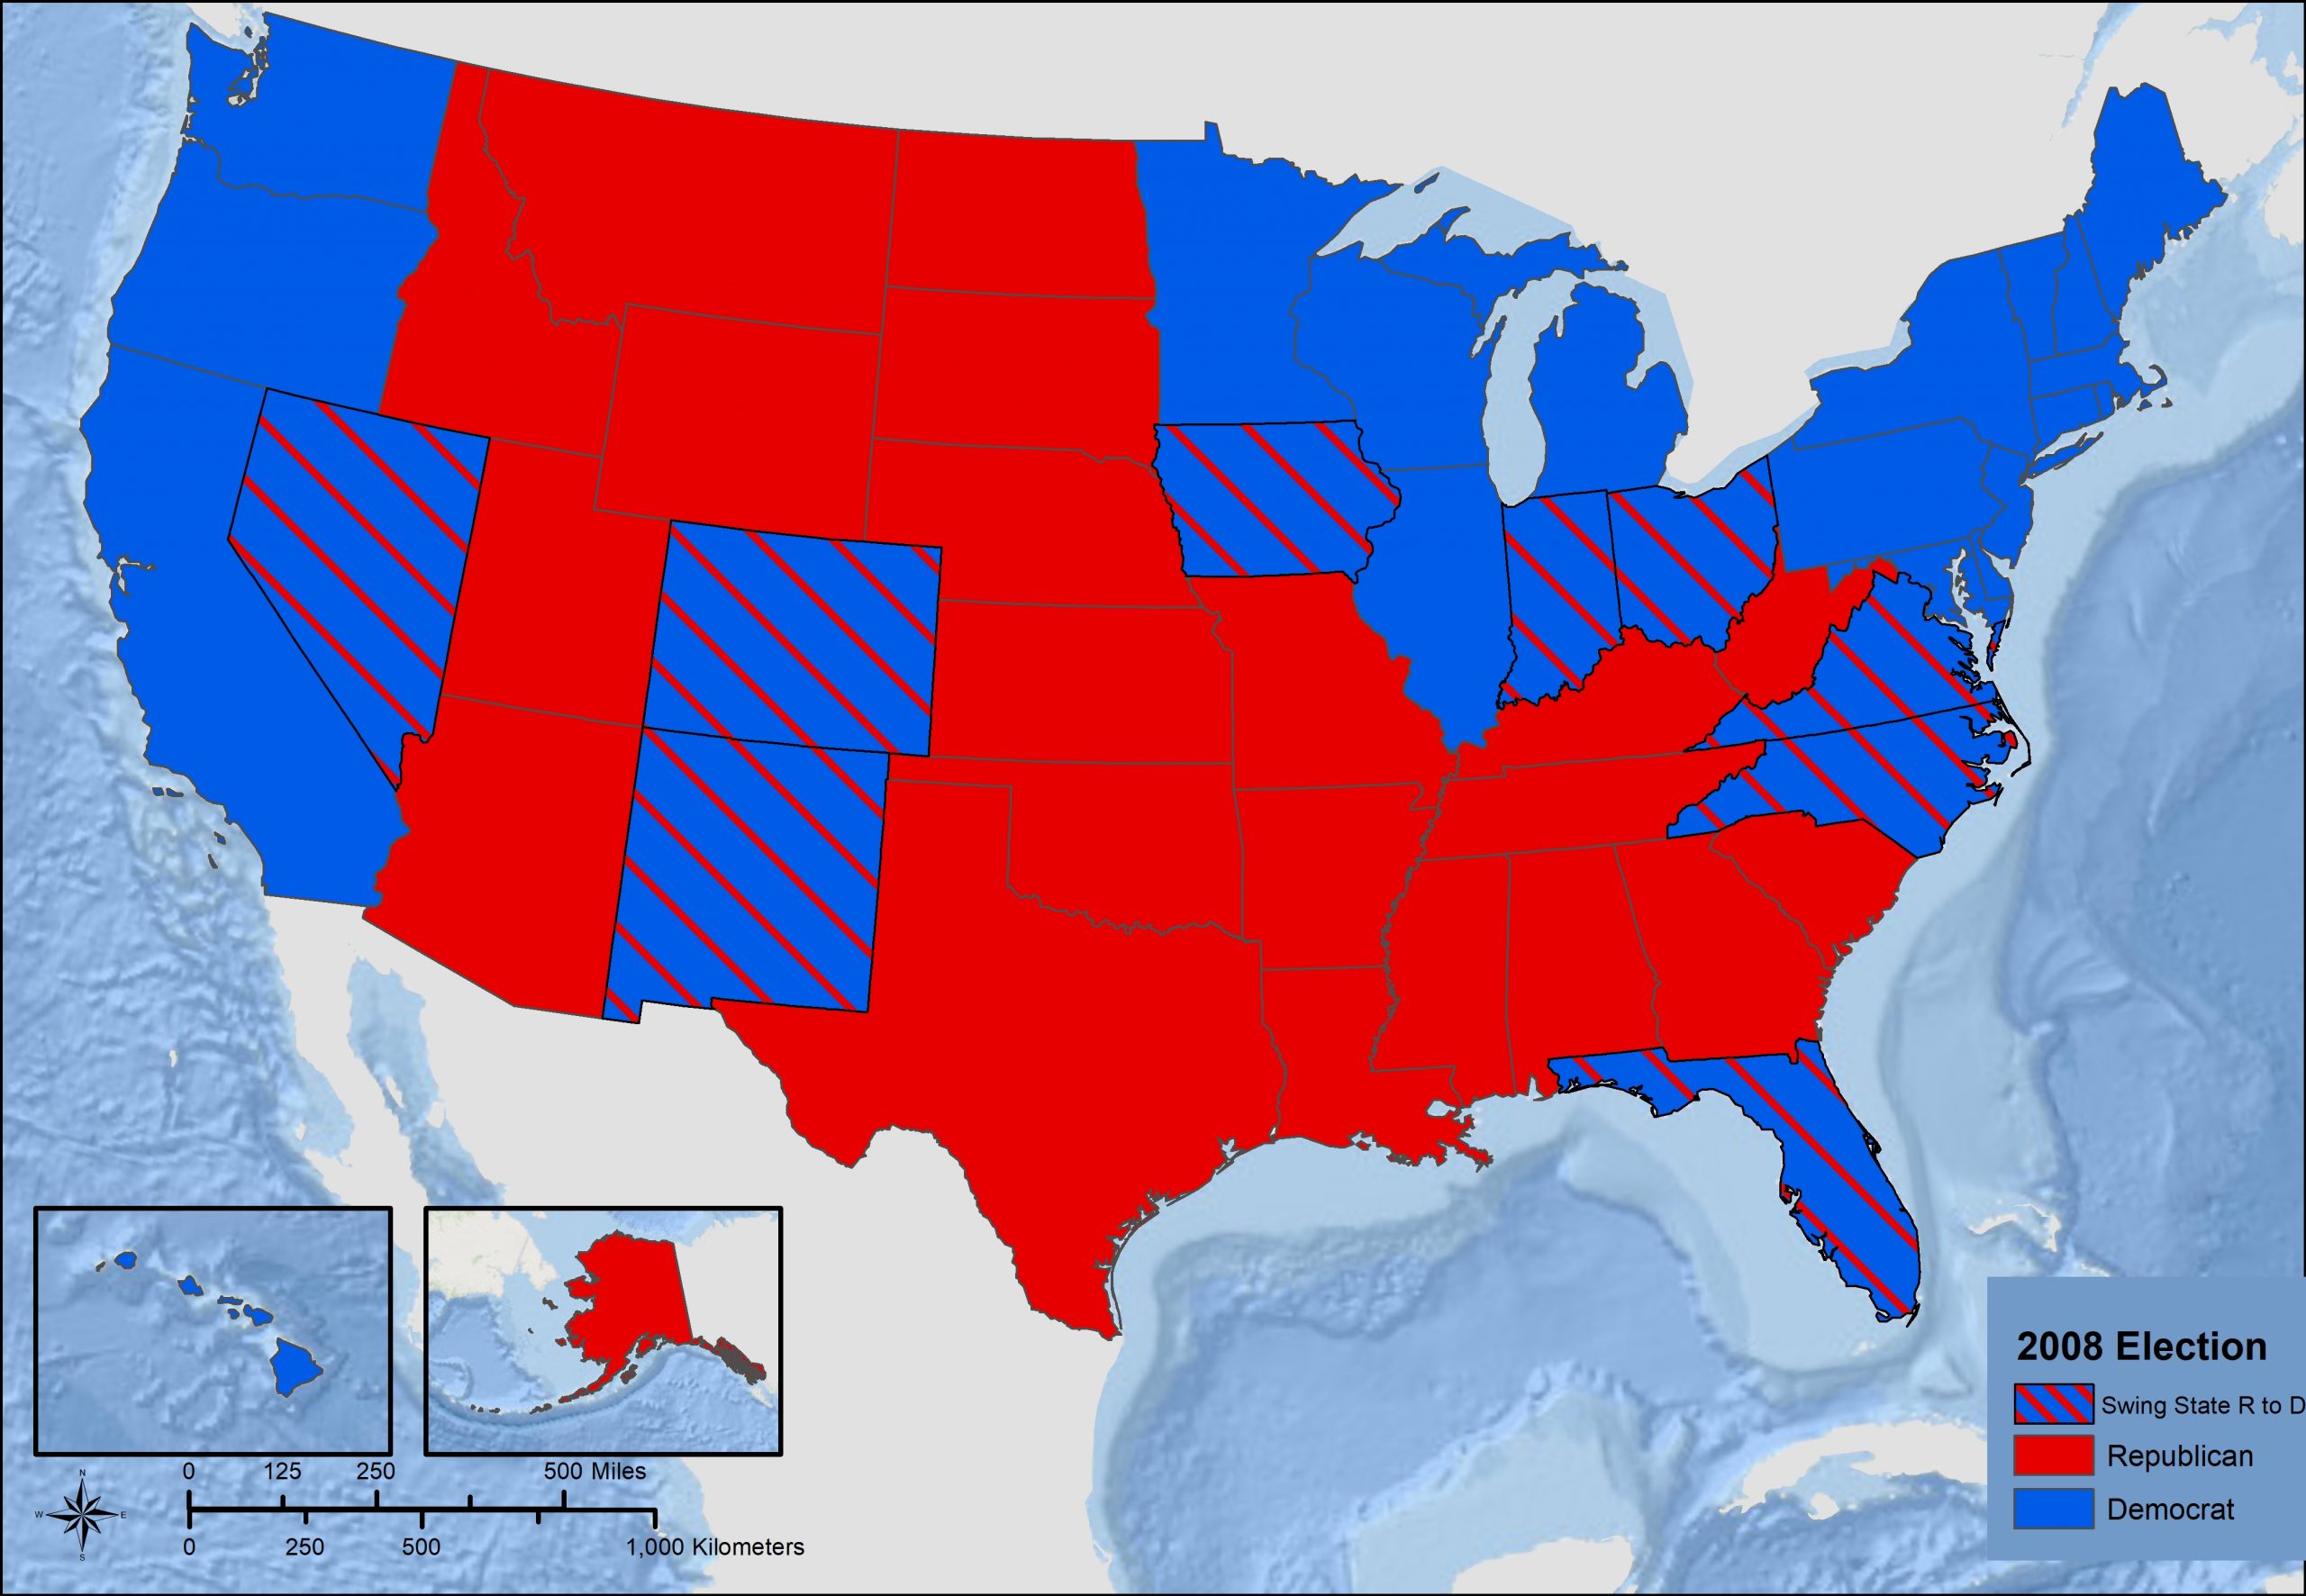
The 2008 election pit two senators against one another – Democrat Barack Obama and Republican John McCain. Senator McCain did not have to reinvent the wheel in this election. There was no need for him to pick up any states that Democrats had won in 2004. He simply needed to recreate the electoral map that had elected George W. Bush. Likewise, Senator Obama did not need to completely rearrange the electoral map. He simply needed to swing enough states out of the Republican column and into the Democratic column. He did just that. Nine states that had voted for Bush in 2004 swung to the Democrats in 2008 – Nevada, Colorado, New Mexico, Iowa, Indiana, Ohio, Virginia, North Carolina, and Florida – giving Obama 365 electoral votes to McCain’s 173.
One of the peculiarities of the electoral college can be seen in the 2008 election. The two biggest prizes in the electoral college – California, with fifty-five electoral votes, and Texas, with thirty-four electoral votes – received practically no attention from either candidate. This is because of the winner-take-all nature of the electoral college. McCain received 37% of the popular vote in California. If McCain had spent millions of dollars and done weeks of campaigning in California, and managed to raise his share of the popular vote up to 45%, how many more electoral votes would he have received? Zero. Likewise, if Obama had poured resources in Texas, and raised his popular vote share from 45% to 49%, he wouldn’t have gained any additional electoral votes. If a candidate has little hope of winning a state, it makes little sense to campaign there. Time and money are better spent on states where victory is possible – that is, in the swing states.
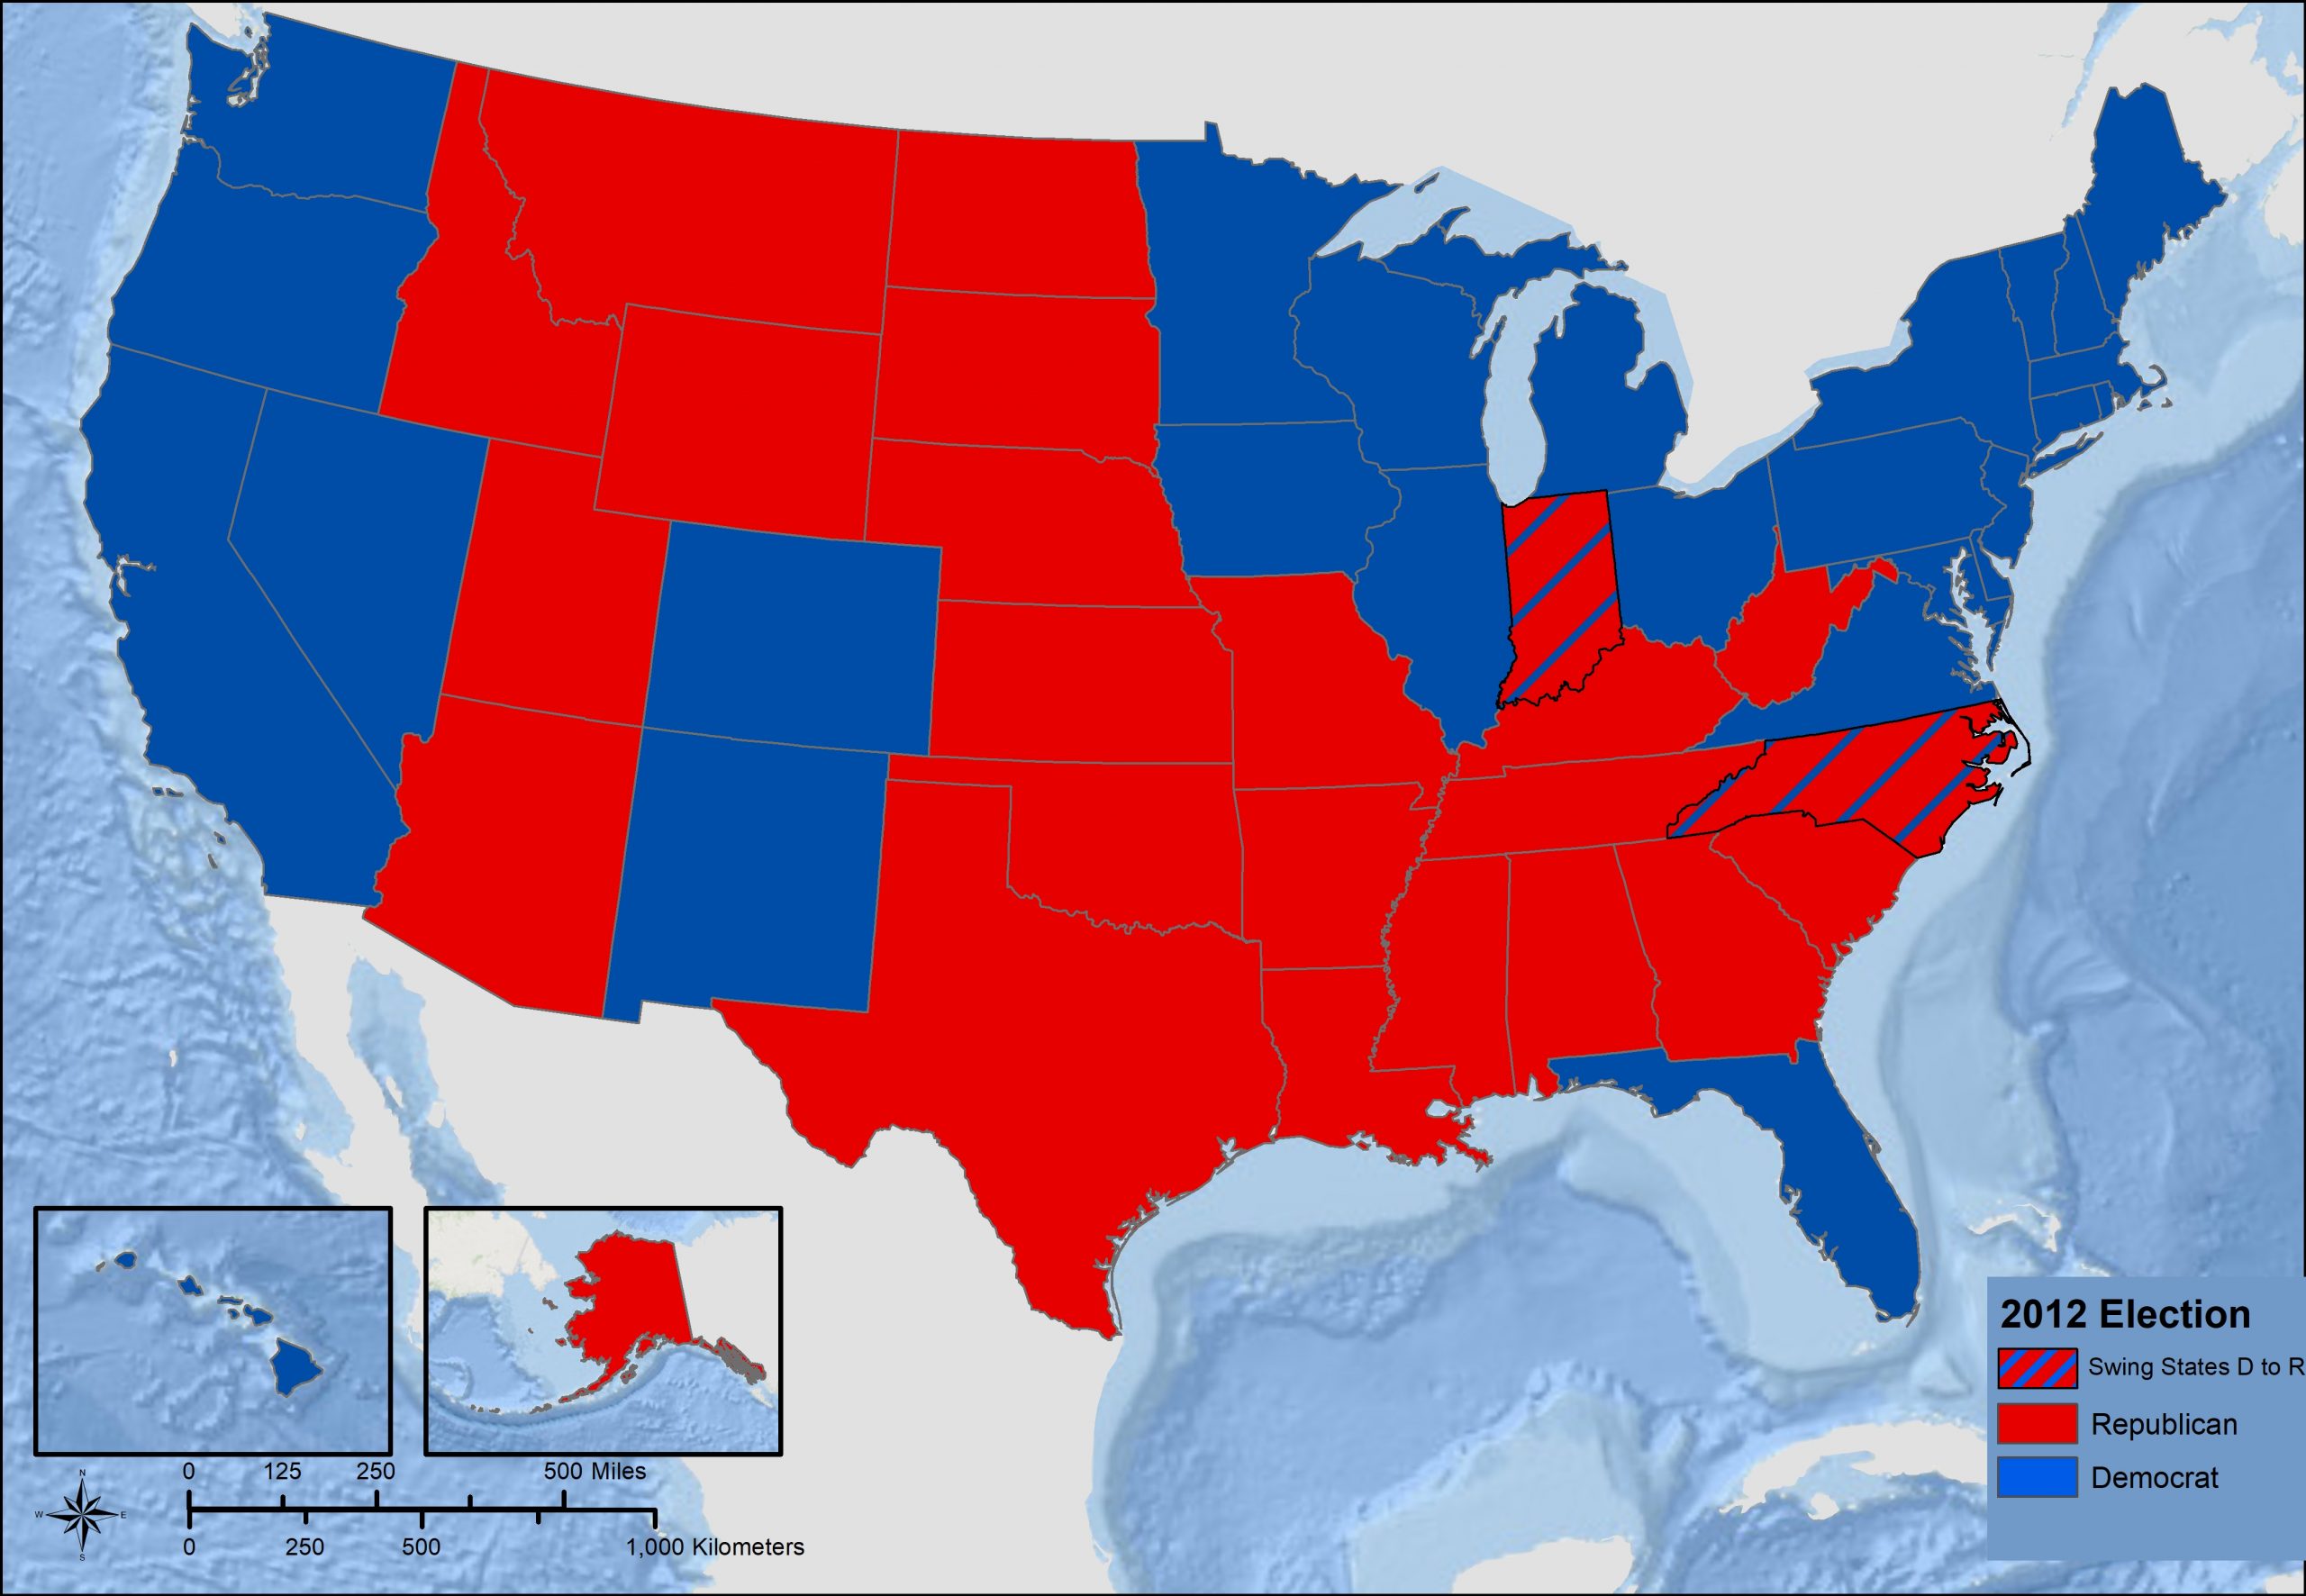
In 2012, the Republicans nominated former Massachusetts governor Mitt Romney to take on President Obama. Obama was looking to recreate his 2008 victory map, while Romney attempted to nudge some of 2008’s swing states back into the Republican column. Romney was able to swing two of them – North Carolina and Indiana – but that was not enough to get the Republicans back to 270, and Obama won reelection with a 332-206 margin in the electoral college.
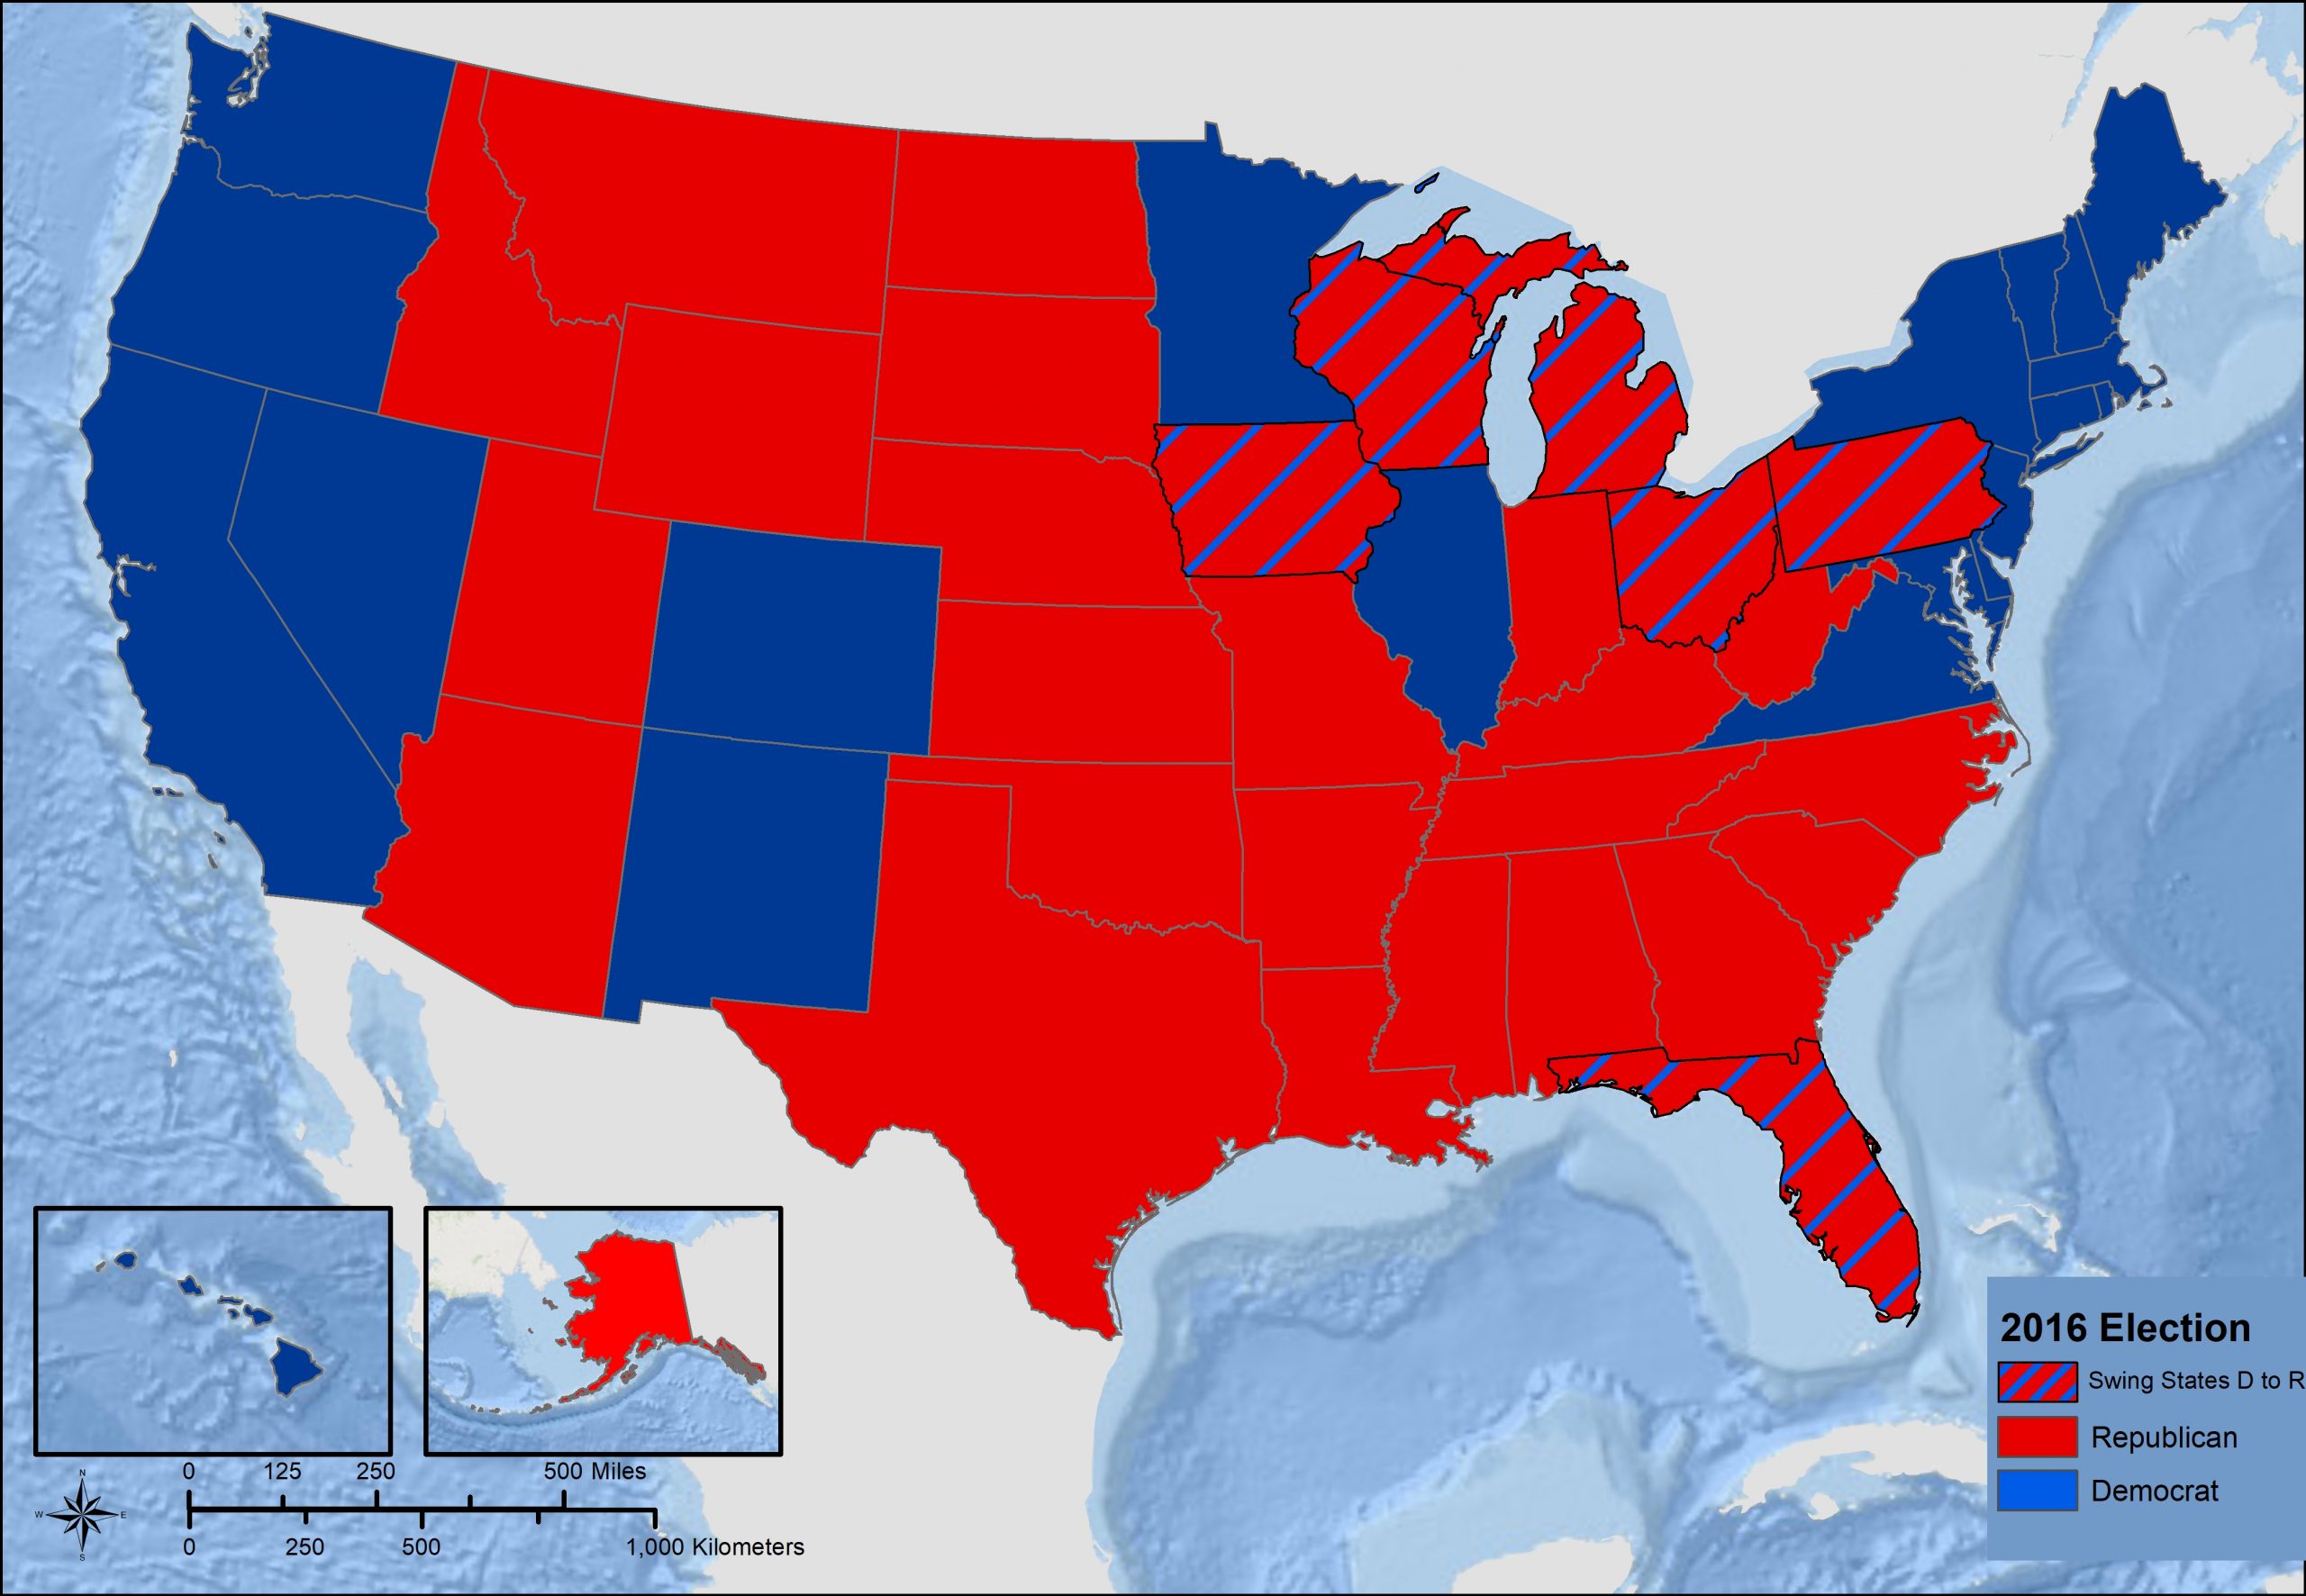
In 2016, Democratic nominee Hillary Clinton was looking to maintain the Obama victory map, while Republican nominee Donald Trump sought to flip some of the Obama swing states. Trump managed to swing three of them – Iowa, Ohio, and Florida – and won upset victories in Wisconsin, Michigan, and Pennsylvania, none of which had voted for a Republican presidential candidate since the 1980s. Although he lost the popular vote, Trump won the electoral college 304-227.
As this chapter is being written, the 2020 presidential election is still several months off. President Trump is looking to recreate his 2016 victory map. The Democratic nominee, former Vice President Joseph Biden, is hoping to recreate the Obama victory map. Several states are in play, but all eyes will almost certainly be on the six swing states that voted for both Obama in 2012 and Trump in 2016 – Iowa, Ohio, Florida, Wisconsin, Michigan, and Pennsylvania.
Did You Know?
In this animated feature from November 2, 2020, this Visual Capitalist link displays the trends of statewide voting in presidential elections from 1976 to 2016.
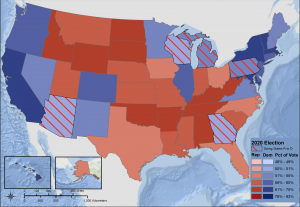
Following the pattern of maps in this chapter, here above is the map of swing states for the 2020 presidential election.
When you vote for a presidential candidate, you’re actually voting for a slate of electors. Each party selects these electors long before the election. After the election, the electors from the winning candidate’s party travel to their state capital and cast their ballots for president. In most states, the electors are required to vote for the candidate who won their state’s popular vote. In some states, that is not a requirement, and occasionally electors have gone rogue. They are known as “faithless” electors, and there were seven of them in 2016. Five electors abandoned Hillary Clinton, and two abandoned Donald Trump. As a result, Colin Powell, John Kasich, Ron Paul, Bernie Sanders, and Faith Spotted Eagle each received electoral votes. It did not affect the outcome of the election. On July 6, 2020, the US Supreme Court unanimously ruled that state laws allowing faithless electors are constitutional
Cited and additional bibliography:
Wandersen, Jeff. 2020 Presidential Election – Swing States. College of DuPage, 12 Jan. 2021.
———. 2016 Presidential Election – Swing States. College of DuPage, 12 Aug. 2020. College of DuPage GIS Class. Instructor Joseph Adduci.
———. 2004 Presidential Election – Swing States. College of DuPage, 12 Aug. 2020. College of DuPage GIS Class. Instructor Joseph Adduci.
———. 2008 Presidential Election – Swing States. College of DuPage, 12 Aug. 2020. College of DuPage GIS Class. Instructor Joseph Adduci.
——— 2012 Presidential Election – Swing States. College of DuPage, 12 Aug. 2020. College of DuPage GIS Class. Instructor Joseph Adduci.
Wi, Wichai. Electoral College by Wichai Wi from the Noun Project, thenounproject.com/search/?q=electoral%20college&i=3189324. Accessed 12 Aug. 2020.
