8 Population Geography –
Concepts and Terminology
“The whole problem with the world is that fools and fanatics are always so certain of themselves, and wiser people so full of doubts.”
– Bertrand Russell, British philosopher

Population geography is the study of the spatial distribution of human population, and of the population characteristics of individual regions and places. It includes studies of population growth and decline, as well as the migration of people from one place to another.
Global Population Distribution and Population Density
The current world population is approximately 7.8 billion, and that population is very unevenly distributed among the world’s 193 independent countries that are members of the United Nations. The world’s two most populous countries, China and India, collectively account for over a third of the world’s population. The world’s seven most populous countries, China and India along with the United States, Indonesia, Brazil, Pakistan, and Nigeria, collectively account for more than half the world’s population. The population of some countries is, by comparison, very small. The Republic of Ireland, for example, has a population of just under five million, or about half that of the Chicago metropolitan area.
A useful statistic when examining population distribution is population density, which is the population of a country divided by its land area. This statistic is somewhat tricky when used to rank countries. Microstates, city-States, and small island countries typically have high population densities due to the limited areas available. Cities inherently are more crowded than rural areas; thus, a country that is precisely one city is intensely crowded – Monaco and Singapore, for instance. Therefore, if you exclude microstates, city-States, and small island countries, then Bangladesh is the most densely populated country on Earth, with a population density of more than 3,200 people per square mile.1 In contrast, Russia is sparsely populated, but as the world’s largest country by area, it has a density of just over twenty-three people per square mile. Remarkably, Russia, which is more than a hundred times the size of Bangladesh, has about twenty million fewer people.
Population Density of Selected Countries
| Selected Countries | Population Density, as people per square mile |
|---|---|
| Bangladesh | 3277 |
| Netherlands | 1316 |
| India | 1202 |
| Haiti | 1072 |
| Japan | 898 |
| China | 397 |
| United States | 93 |
| Estonia | 81 |
| Brazil | 65 |
| Norway | 38 |
| Russia | 23 |
| Canada | 10 |
| Australia | 8 |
Population Change
 A primary tool geographers use when analyzing population change is the population pyramid. A population pyramid is a graph depicting the distribution of a population across various age brackets. If a country’s pyramid has a wide base and narrow top, such as Niger (https://tinyurl.com/nigerpoppyr), that indicates that a large proportion of the population is relatively young. Such countries are experiencing rapid population growth. If a country has a narrow base and a wide top, such as Japan (go to https://tinyurl.com/poppyrJapan), that indicates that a large proportion of the population is relatively old. Such countries are facing long-term population decline. If the pyramid resembles a column, such as the United States (https://tinyurl.com/usapoppyr), that indicates that population is distributed relatively evenly across the age groups, indicating slow or no population growth.
Rate of natural increase is a statistic that examines population change through births and deaths. It is calculated by subtracting a country’s death rate from its birth rate. A birth rate indicates the number of children born every year per thousand people in a country’s population.2 The United States’ birth rate is 12/1000, meaning that, for every thousand people in the country, twelve are added through births each year.
Birth Rates of Selected Countries
| Country | Region | Birth Rate 2018 |
|---|---|---|
| Angola | Africa | 43.7 |
| Afghanistan | Asia | 37.5 |
| Guatemala | LACAR | 24.6 |
| Solomon Islands | LACAR | 24.5 |
| Ireland | Europe | 13.8 |
| USA | North America | 12.4 |
| Georgia | Russian Domain | 12.1 |
| Portugal - lowest in the Western World | Europe | 8.2 |
| Japan - lowest in the world | Asia | 7.5 |
A death rate indicates the number of people who die each year per thousand people in a country’s population.3 The United States’ death rate is 8/1000, meaning that, for every thousand people in the country, eight die each year.
Death Rates of Selected Countries
| Country | Region | Death Rate 2018 |
|---|---|---|
| South Sudan | Africa | 19.3 |
| Afghanistan | Asia | 13.2 |
| Cuba | LACAR | 8.9 |
| Tuvalu | Pacific Realm | 8.4 |
| Lithuania | Europe | 14.8 |
| USA | North America | 8.2 |
| Ukraine | Russian Domain | 14.3 |
| Solomon Islands - lowest in the Western World | Pacific Realm | 3.8 |
| Qatar - lowest in the world | Asia | 1.6 |
Natural increase is the comparison of the birth rate to the death rate. Births are added, while deaths are subtracted to the base population. So, the United States’ rate of natural increase is 4.2/1000 (or 0.42% increase).
Another statistic used in the study of population change is total fertility rate, or TFR. A country’s TFR is similar to its birth rate, and is based on the same data. Countries with high birth rates have high TFRs, and countries with low birth rates have low TFRs. TFR reflects the number of children that an average female in a country will have during her lifetime. TFRs vary widely from country to country. Niger has a TFR of about 6.35. Taiwan has TFR of about 1.13. So, it is typical for a female in Niger to have six children during her lifetime. In Taiwan, a typical female has just one. Again, microstates and similar regions may have exaggerated numbers, in this case especially low – Singapore = 0.84. The table below shows the high points of TFR for regions of the world.4
Total Fertility Rate (TFR) of Selected Countries
| Country | Region | Total Fertility Rate 2018 |
|---|---|---|
| Niger | Africa | 6.35 |
| Afghanistan | Asia | 5.02 |
| Solomon Islands | Pacific Realm | 3.09 |
| Guatemala | LACAR | 2.87 |
| France | Europe | 2.06 |
| USA | North America | 1.87 |
| Armenia | Russian Domain | 1.64 |
To maintain zero population growth, or long-term population stability, a country generally must have a TFR of about 2.1. If a country’s TFR is higher than 2.1, it is likely to experience population growth. If it is lower than 2.1, a country is likely to experience population decline.
A country’s population can also be affected by immigration and emigration. Immigration refers to the entrance of migrants, while emigration refers to the exit of migrants. The net migration rate refers to the difference between annual immigrants and emigrants per one thousand people in a country’s population. The United States has a net migration rate of 2.9/1000, meaning that the U.S. gains about three net migrants per thousand people each year. El Salvador, by contrast, has net migration rate of about -8/1000, meaning that the country loses about eight net migrants per thousand people each year. Here are a sample of net migration rates by country 2015-2020.5 Oil states often have high net migration rates, as workers flow into the country.
Net Migration for Selected Countries
| Country - 2015-2020 | Net Migration Rate |
|---|---|
| Bahrain - #1 in world | 31.1 |
| Austria - #1 in Europe | 7.4 |
| Canada - #1 in North America | 6.6 |
| Australia - #1 in Pacific Realm | 6.4 |
| Chile - #1 in LACAR | 6 |
| USA | 2.9 |
| Russia - #1 in Russian Domain | 1.3 |
| Ê Ê Bottom three | |
| Venezuela - economic chaos | -22.3 |
| Syria - war | -24.1 |
| Puerto Rico - natural disasters | -31.4 |
The Population Explosion and the Malthusian Scenario

The graph of historic human population growth is often referred to as the “J-curve.” It reflects that fact that human population has not grown at a consistent rate over the last several thousand years. Instead, human population grew very slowly for centuries and then exploded upward. This population explosion began in the 1700s, and accelerated dramatically in the 20th century. Human population is estimated to have been approximately 300 million in the first century CE. By 1650, it had grown to just 500 million. By 1900, it was more than a 1.5 billion. In 1950, it was 2.5 billion. By the year 2000, it was over 6 billion, and is projected to reach nearly 9 billion by the year 2050.
Such growth rates cannot be sustained indefinitely. Thomas Malthus, an 18th-century English priest and scholar, was among the first to address overpopulation. Malthus noted that earth’s capacity to sustain human population was finite, and warned that unchecked human population growth would lead to a demographic collapse – that is, the deaths of millions of people. In this Malthusian scenario, human population exceeds the earth’s capacity to sustain it, and famine, war, or disease lead to increased death rates. Malthus argued for a positive alternative to this population catastrophe – that humans voluntarily reduce their birth rates, leading to stable and sustainable global population.
The Demographic Transition
The J-curve and the Malthusian scenario raise two fundamental questions. First, what caused the population explosion? Second, will the population explosion continue toward a Mathusian scenario, or will it eventually come to an end? Both questions are addressed by a population model known as the demographic transition. Go to https://populationeducation.org/what-demographic-transition-model/ to view the model.
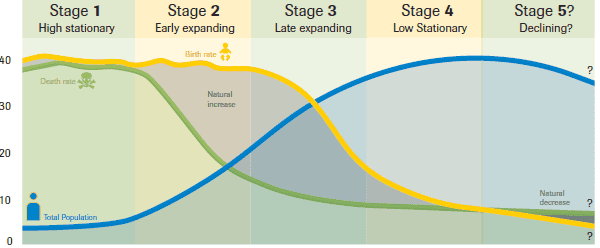
The demographic transition examines birth rates and death rates in societies before, during, and after the industrial revolution. There are four (or some say, five) stages in this model: the pre-industrial, the early industrial, the late industrial, and the post-industrial. It isn’t appropriate to put exact dates on these four stages, since different parts of the world experienced them at different times. Great Britain, the birthplace of the industrial revolution, began to move through this transition in the 1700s. By contrast, much of Sub-Saharan Africa wouldn’t begin the transition until well into the 20th century.
The pre-industrial stage (Stage 1) represents the majority of human history, extending from the dawn of human civilization until the industrial revolution. During this stage, the vast majority of humans lived in rural areas and farmed for a living. Living standards were poor, and technology was extremely limited. Birth rates in the pre-industrial stage were extremely high. It was common for families to have at least eight children, and many families were much bigger than that. A primary reason for this high birth rate was the economic status of children. Children were viewed as an economic asset. A child, from a very young age, could provide labor on the family farm. The more children, the more labor. Additionally, children served as a sort of retirement plan, providing elder care for their aging parents. And in an era of extremely high child mortality rates, when a famine or epidemic could take the lives of scores of children in a short time, parents felt compelled to have larger families as a sort of insurance against that possibility. Children were also relatively cheap. They were fed with food from the garden, not from the supermarket. For the vast majority of history, farm children didn’t attend school, and they didn’t go to the doctor or dentist. There was no health insurance or college tuition to pay for. Factories didn’t exist in the pre-industrial stage, so there were few possessions that parents could provide for their children, let alone afford. Additionally, the reproductive window for parents was relatively long. People got married at very young age, and had children early and often. Another major reason for high birth rates was the lack of modern contraceptives.
With such high birth rates, it is tempting to conclude that this was the era of the population explosion. It wasn’t. Rather, the pre-industrial stage represents the long, flat part of the J-curve. Although birth rates were extremely high, so were death rates. Even on farms, diets were often inadequate, and always at the mercy of the seasons and the quality of the harvest. People also lived in comparatively unhygienic conditions, without refrigeration, treated drinking water, or modern sanitation. As a result, people got sick more often, and there was no modern medicine to prevent or treat health problems. With the very high birth rates checked by high death rates, human population grew very slowly, and sometimes not at all, during the pre-industrial stage.
The beginning of the early industrial stage (Stage 2) was marked by the advent of the industrial revolution and all the developments that came with it – modern factories, modern agriculture, modern science, and modern medicine. During this period, human population began a slow transition away from rural areas toward urban ones. The mechanization of agriculture reduced the need for labor on farms, and the rise of the factory increased the need for labor in cities.
Birth rates during this stage remained relatively high. Although urbanization was underway, the majority of the population remained in rural areas. In the United States, for example, industrialization was in full swing by the mid-1800s, but the country would not have a majority urban population until the 1920s. Although birth rates began to dip slightly on the farms, they were still comparatively high, for the same reasons they were high in the pre-industrial stage. Even in industrial cities, where having large families was less practical, family sizes remained relatively large due to cultural conventions. Most parents from this era came from large families and, as such, were more likely to have large families themselves.
 Ironically, even though the early industrial stage saw a slight decline in birth rates, it was the beginning of the population explosion. The population explosion was not caused by an increase in birth rates, but rather by a decline in death rates. New technologies that accompanied the industrial revolution – modern medicine (in particular, vaccines), improved sanitation, refrigeration, water treatment, and modern agriculture, among others – caused death rates to plummet. As the gap between birth rates and death rates widened, the rate of natural increase soared, and population exploded upward.

During the late industrial stage (Stage 3), the majority of the population shifted away from the farm to the city, technology continued to advance at a rapid pace, and standards of living improved dramatically. In this period, birth rates declined significantly. A primary reason is a change in the economic status of children. On the farm, children were considered an economic asset. In cities and their suburbs, children began to be viewed as an economic liability. In modern cities, children are no long able to provide significant income for their family. Additionally, children become far more expensive. Health care costs increase. Children spend more years in school, and therefore remain financially dependent on their parents for a longer period of time. Most importantly, cultural standards for children rose, and parents were inclined to spend more money on them. Large families began to seem unaffordable. Accompanying this change in the economic status of children was a change in the economic situation of their parents. During this period, parents were likely to finish high school, and possibly college, before starting a career. And they often chose to work for a few years before starting a family. As a result, the reproductive window for parents began to contract, and family size along with it. Death rates remained relatively low during this period. As the gap between birth rates and death rates narrowed, population growth rates declined.
Wealth and technology continue to grow during the post-industrial stage (Stage 4). In this period, agricultural and industrial output continues to expand, but the majority of the population shifts toward employment in the service and information sectors. Birth rates continue their steep decline as children become very expensive, and as more people, particularly women, choose to complete a college education. Marriages are further delayed, and the reproductive window closes even more. Cultural norms shift toward smaller and smaller families. While it might have been “normal” to have a dozen children during the pre-industrial stage, and perhaps four, five, or six during the industrial stages, the new normal for children during the post-industrial stage becomes two, or one, or none. Death rates remain low as birth rates plummet. As a result, population growth rates become very low. In fact, birth rates might even slump below death rates during this period, leading to long-term population decline. Is this form of population decline a new stage of the Demographic Transition or simply a facet of the post-industrial stage? Some argue that a consistent pattern of more deaths than births marks something new, thus a Stage 5 of the Demographic Transition.
What does this mean for the future of human population growth? Some places, such North America, Europe, the Russian Domain, and East Asia are clearly in the post-industrial stage, with TFRs already below 2.1. Other places that were rapid-growth regions a generation ago, such as Latin America, South Asia, and Southeast Asia, are experiencing significant declines in birth rates as urbanization surges and cultural attitudes change. A few places, notably Sub-Saharan Africa, continue to experience rapid population growth. Still, the global TFR is now about 2.5, and is projected to drop below 2.1 by the middle of this century. The population explosion, then, is expected to come to a close by the end of the century.
Migration
 Population geography also examines the movement of people, and significant migration patterns will be discussed in the regional overviews. In general, the two most significant migration flows in recent years has been from rural to areas to urban ones, and from poorer countries to wealthier ones.
When examining migration, geographers analyze the migration decision, which are the factors that motivate a person to move. Any time a person decides to change residence, be it a move across town, or across the country, or around the world, that decision is informed by push factors and pull factors. A push factor causes a person to choose to emigrate away from the current location. Some common push factors include high unemployment, low wages, high rates of poverty or crime, land or housing shortages, war, natural disasters, or poor government services. A pull factor causes a person to immigrate to a particular destination. Some common pull factors include a greater availability of jobs, higher wages, a chance for upward economic mobility, better government services, the opportunity to provide remittances (money sent back home to one’s family), or, simply, a desire for a more exciting lifestyle.
Did You Know?
Japan’s TFR is about 1.4, well below the 2.1 required to maintain population stability. Japan’s current population of 126 million is projected to decline to less than 100 million by the year 2053. This fact may force Japan to reconsider its long-standing stance against immigration.
The number of countries of the world, set at 193 members of the United Nations, does vary by other levels of recognition. Non-member observer States – Vatican City and Palestine – could be counted. The figure of 193 does not include Taiwan, the island considered by some as part of mainland China. That number does not count Abkhazia and South Ossetia – see Chapter 86 – and several other regions generally unrecognized by nearly all countries of the world.
Did you notice the numbers for the Solomon Islands in the birth and death rate tables? With a birth rate of 24.3, the Solomon Islands ranked highest in the Pacific Realm, only 0.1 from being the highest birth rate in the Western World. This country has the highest total fertility rate in the Western World at 3.09. For death rates, the Solomon Islands did have the lowest death rate (3.8) in the Western World! These number mean that this country has a natural increase of 2.05% per year, quite high in population standards. This rapid increase may explain the islands migration rate of -2.5%.
Cited and additional bibliography:
1 StatisticsTimes.com. 2019. “Countries by Population Density 2019.” Statisticstimes.Com. 2019. http://statisticstimes.com/demographics/countries-by-population-density.php. UN (World Population Prospects 2019).
2 “Birth Rate – Country Comparison.” 2019. Www.Indexmundi.Com. January 1, 2019. https://indexmundi.com/g/r.aspx?t=0&v=25&I=en.
3 “Death Rate – Country Comparison.” 2019. Www.Indexmundi.Com. January 1, 2019. https://indexmundi.com/g/r.aspx?t=0&v=26&I=en.
4 “Population – Country Comparison – Total Fertility Rates.” 2019. Www.Indexmundi.Com. January 1, 2019. https://indexmundi.com/g/r.aspx?v_31.
5 “List of Countries by Net Migration Rate.” 2020. Wikipedia. May 28, 2020. https://en.wikipedia.org/wiki/List_of_countries_by_net_migration_rate#cite_note-2.
GREY Perspective. n.d. Population Pyramid by GREY Perspective from the Noun Project. Accessed June 3, 2020. https://thenounproject.com/search/?q=population%20pyramid&i=2305354.
Grover, Drew. 2018. “What Is the Demographic Transition Model?” Population Education. November 16, 2018. https://populationeducation.org/what-demographic-transition-model/.
“Population Pyramids of the World from 1950 to 2100.” 2019. PopulationPyramid.Net. 2019. https://www.populationpyramid.net.
